The disruptive idea low-code platforms

Are you trying to get another 10% out of your development team? When it comes down to the wire, is development always taking the longest time to deliver? Today, I’m going to provide insights into how to get over that organizational obstacle.

Hi, I’m Peter Nichol, Data Science CIO.

One of the most significant changes in information technology is in development. Over the last decade, we’ve experienced a pivot in what’s included in corporate development teams, the state of development performance, and many questions around the future of development.

Is IT development going offshore? Will tomorrow’s development teams be comprised of hybrid and onshore models? What’s the future of development? Do we even need developers anymore?

Here’s my take on these questions. Yes, progressing companies will require in-house developers to build and expand on organizational core competencies. However, new development models are emerging in the corporate world.

We won’t be talking about the onshore, near-shore, far-shore, or off-shore models of yesteryear. Instead, IT development models need to account for changing business demands. Most specifically, conventional development time can’t be cut by 10%. Rather, it has to be chopped by 50% or 70%. That’s what’s required to keep up with the dynamic business environment of today. Technology leaders understand this, and they’re responding and changing the composition of their teams.

New IT development models need to respond faster and specifically anticipate changing business demands while the traditional costs of large development teams need to fade into the sunset.

Leaders are looking to no-code, low-code, and full-code as the future. So, let’s get into it.

As I walk through these models, consider applications in your environment today. Which applications might be more conducive to low-code versus full-code? How can you optimize your development teams to squeeze out that 10% or 50% of efficiency that’s required? What if you limit your power developers and bring up potential developers through a no-code or low-code model? It might just work and save you millions.

Let’s being with no-code. This type of technology typically consists of mainly drag-and-drop functionality. This basic functionality is leveraged for reporting or elementary transactional systems that citizen-developers can drive. You don’t need full-fledged developers to drive low-code solutions.

Here are a few solutions you can consider when exploring no-code development environments:

  • Adalo
  • Visual LANSA
  • GeneXus
  • Zoho Creator
  • Appy Pie
  • AppSheet
  • Airtable
  • Visual LANSA
  • GeneXus
  • Zoho Creator

Immediately, applications like Abby Pie, AppSheet, or Airtable come to mind.

However, if you require functionality to support a bit more complexity, we enter the low-code environment. In this environment, you may have more complicated database calls. In addition, there may be multiple integrations that don’t lend themselves so well to drag-and-drop functionality (ActionDesk, Parabola, Flow, IFTT, Zapier).

In the low-code space, there are numerous options to explore:

  • WordPress
  • Appian
  • Boomi
  • Creatio
  • GoodBarber
  • Mendix
  • Microsoft Power Fx
  • Oracle Application Express

I think of companies like Mendix, Appian, or even WordPress that are a little more plug-and-play. The benefit of low-code is you begin to have a more capable interface for drag-and-drop functionality. You also have access to include custom code, call APIs, and more complex database calls into your deployed applications.

Last, we have full-code environments. When deciding to adopt a full-code model, you want precise flexibility. You must architect a system for a given purpose. Your designs don’t support template-based architectures but are fit-for-purpose solutions that are generally viewed as highly capable—otherwise known as complex.

Typically, these applications are designed for high availability (HA) or deal with big data sets. These systems are usually highly transactional in nature and support high throughput and significant transactions per second.

There are loads of great examples of full-code environments. These languages are commonly complex and can support very prescriptive coding to address very narrow business cases:

  • JavaScript
  • Python
  • C/C++
  • JAVA
  • R Language
  • Kotlin
  • C#
  • PHP
  • Go
  • Scala

Traditional full-code environments that come to mind include Java, Python, or C++. Each of these is a full-fledged programming language.

Do you genuinely require all your developers to be full-code capable? Is there another option to segment your team’s capabilities and align them to departmental or organizational needs?

What would your future-state architecture look like if your model supported no-code, low-code, and full-code development environments? Not every business unit requires custom applications. Many are satisfied with accurate reports that are developed and published promptly.

Here are questions to consider:

  • Where is our future-state architecture headed?
  • How many full-code developers do we require on staff?
  • Which organizational needs can be met with no-code or low-code capabilities?
  • What percentage of developers are full-code?

Suppose your technology capabilities have only been focusing on full-code environments. In that case, you might be able to pull and grow some internal resources into the low-code or no-code areas to optimize outcomes. These are just a few ideas to think about as you consider your development team.

If you found this article helpful, that’s great! Check out my books, Think Lead Disrupt and Leading with Value. They were published in early in 2021 and are available on Amazon and at http://www.datsciencecio.com/shop for author-signed copies!

Hi, I’m Peter Nichol, Data Science CIO. Have a great day!

A dynamic collaboration model for introducing change that sticks

Have you ever joined a meeting only to find that a new initiative was being launched that you had no idea about? Have you ever been on a conference call—curious to hear about the next steps of the project—only to find it had pivoted 180 degrees and was now rushing off in a new direction?

Hi, I’m Peter Nichol, Data Science CIO.

Today, I’ll provide some insights into and how to get ahead of some of these challenges. As our teams have transitioned from working almost entirely on-site—with some remote access—to working almost entirely remotely, the number of micro-interactions have decreased. As a result, teams are feeling disconnected from their members and their organizations. They’re often not involved early in initiatives but, instead, informed quite late in the process.

Our challenge, as executives, is to make sure we present and introduce new ideas and opportunities to our teams and organizations early. We need their input and engagement in order to be successful. We want leaders and team members to feel connected, feel they had a chance to contribute, and believe their voice was heard.

A model has been developed to tackle these questions:

  • How do you introduce a new concept to an organization?
  • How will that change affect your teams?
  • How do you build a community of support to help advance and accelerate organizational adoption?
  • So how do you meet deadlines when communication organizationally is a slow process?
  • How do we drive positive tactics to encourage outcomes?
  • Can we validate that our teams have effectively socialized the idea?

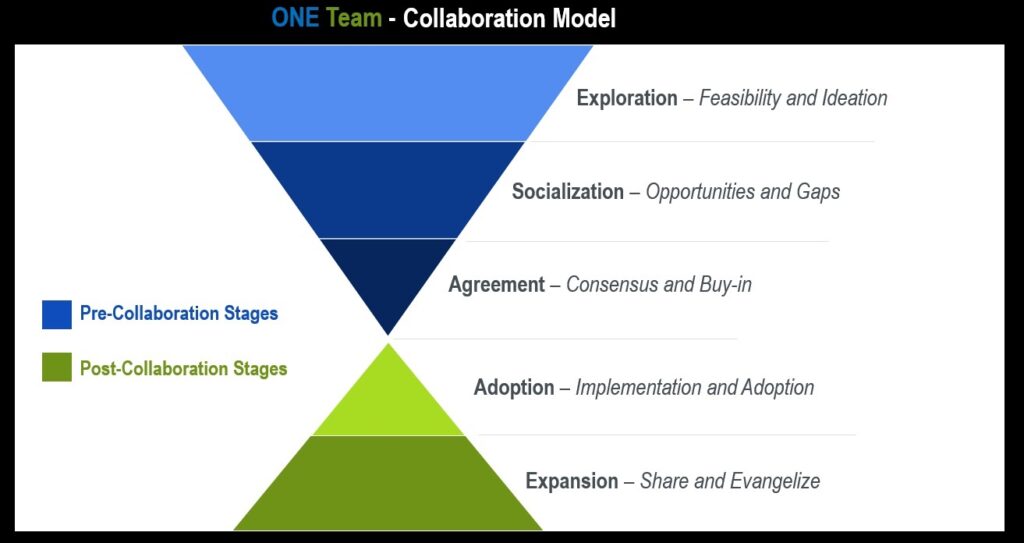
Over the last several years as a business relationships executive, I generated a model called, “ONE Team,” also known as, the “Collaboration Model.” Essentially, this model helps focus on the critical elements of socialization that we often overlook as leaders.

The collaboration model has five steps:

  1. Exploration
  2. Socialization
  3. Agreement
  4. Adoption
  5. Expansion

The first step, exploration, is all about creativity and thinking about the possibilities. After that, it’s about identifying the idea and determining feasibility—is it sustainable?

The second step, socialization, is focused on making sure that people are on board with the idea. It’s the process of communicating, sharing, and presenting the idea to others. It’s the exercise of socializing and getting people to understand where you’re going and what’s behind your intent (and is less focused on what you’re going to be doing). Finally, it’s shopping the idea around for input.

The third step is agreement. This means getting people to accept the definition of the problem statement, the solution, and how you’ll approach the opportunity.

The fourth step is adoption. Once you reach an agreement, the idea starts to get traction, and it’s necessary to share it with the organization. At this point, the idea was explored, socialized, agreed to, and rolled out to realize the desired outcomes. It’s ultimately about propagating the concept throughout the organization. This is the process of implementation.

The fifth step is expansion. This step is about evangelizing the idea and sharing the concept throughout other areas of the organization. The theory has been proven to be viable. The desired outcomes—post-implementation—are being realized. It’s now time to share the idea with other areas of the organization. This is where the benefits can be multiplied or duplicated.

The Collaboration Model brings teams together.

This model helps your leadership team get ahead of the challenges and opportunities that affect all leaders as they start to drive and introduce new ideas. Is there is an area other than communications where you spend the most time? Do you spend time buried in production defects? Is your time spent in meetings discussing IT technical debt? Most likely, no. You spend the most time communicating to others the concepts that were deployed or in-flight today or planned for tomorrow. This model solves that problem. It creates a departmental standard for early communication of ideas and broad initiatives that will impact your teams.

One method for presenting this model is to communicate who’s going to be involved at each step. This helps team members know that you’ll be reaching out to them for input. Likewise, this also clarifies that you won’t involve the world in the “exploration phase,” when you don’t even know if the idea will work. Finally, tagging who’s affected by name and including date ranges for each step helps remove assumptions and clarify expectations.

Nobody likes to change, but today’s reality is that change is everywhere. It’s injected into our shifting job roles. Change manifests in how we respond to environmental factors and stimulants. Change is a reality that we must embrace. Moreover, for leaders to have a 10x impact, change needs to occur and behavior modifications need to happen rather quickly across an organization.

You might find yourself recalling Kotter’s change-management model, McKinsey’s 7-S change-management model, or maybe even Lewin’s change-management model. They all offer interesting perspectives, but none is simple enough to be foundational for introducing new initiatives into a department.

We, as leaders, will continue to introduce more and more change into the environments that we’re transforming. Applying the Collaboration Model is one simple process that will help ease people into adopting and changing some of their values, beliefs, and behaviors.

If we introduce change early in the process, the probability of adoption is greater, and the results are better. You’ll no longer join that zoom meeting only to find that a new initiative that impacts your team goes live in a week. Why? You were aware of the change months prior because the team used the Collaboration Model for all new initiatives.

As you become educated on the change, you better understand its purpose, who’s involved, and what’s behind the objectives. The result is that you’re less concerned about the specific details—the milestones and dates—because you were involved from the beginning.

Hopefully, you now have a better idea of how to ensure that your team is tightly connected when launching new, complicated change initiatives throughout your organization. Use the Collaboration Model, and save time communicating by communicating early.

If you found this article helpful, that’s great! Check out my books, Think Lead Disrupt and Leading with Value. They were published in early in 2021 and are available on Amazon and at http://www.datsciencecio.com/shop for author-signed copies!

Hi, I’m Peter Nichol, Data Science CIO. Have a great day!

MLOps moves into production environments for pipeline automation

A new and exciting area is machine-learning operations or MLOps. Today, we’re going to get into how to start and evaluate your machine-learning operations environment.

Hi, I’m Peter Nichol, Data Science CIO.

What is ModelOps?

One of the fascinating aspects of data science is understanding models. Usually, we begin with model operations or ModelOps. ModelOps includes everything that’s required to orchestrate your AI pipeline. A traditional definition of ModelOps might be the lifecycle management of all AI and decision models (including models based on machine learning, knowledge graphs, rules, optimization, linguistics, and agents). ModelOps is the foundation of many data-science environments.

MLOps or machine-learning operations is a subset of ModelOps. MLOps involves models that are trained using data. These models don’t simply replicate or duplicate human actions. They can learn based on outcomes and data loaded or digested into the model. Mature machine-learning operations have to do with the encapsulation and monitoring of those different areas. Essentially, MLOps holds the technical requirements required to keep our models up and running.

Feeding and caring for MLOps

MLOps isn’t explicit. This creates a challenge when we’re trying to deal with models—especially machine-learning models—as they’re not a simple business rules engine. These models have implied inferences that evolve. The data learns on its own. This leads to one of the biggest challenges—model degradation. The models can become highly inaccurate quickly when not properly maintained, especially if there’s an unplanned pivot in the environmental situation. A good example was the Coronavirus. Imagine a ModelOps environment that was creating forecasts in February 2020, and imagine the models it forecasted for March 2020. These didn’t have the same level of quality in terms of accuracy.

Machine-learning models can lose their predictive efficacy quite rapidly.

Here’s one more example. Let’s say we built a machine-learning model and operationalized it using ModelOps and MLOps. Our model was created for the travel industry. The model took into account factors such as airplane reservations, room, and board and built a package based on target demographics, location, and some other geographic factors. All this information was used to develop custom-priced packages with optimal price points. As soon as the Coronavirus wave spanned the country, our model almost immediately became valueless. Consider for a minute how quickly this model became useless. Almost overnight, that model turned out to be grossly inaccurate and, as a result, it probably didn’t help promote the growth it was intended to promote.

Models must be continually tuned and adapted to new conditions. Where does this tuning, maintenance, and upkeep responsibility live? It’s possible ModelOps lives under the CIO. Assuming the CIO owns AI architects and other types of business architects, this might be a logical place of ownership.

Where does MLOps live within the organization?

ModelOps could also live under a CTO. Many CTOs already have accountability for compliance and internal targets that lend themselves well to owning ModelOps.

Lastly, ModelOps might be most at home being nested under the Chief Data Officer’s responsibilities. It’s logical that ModelOps and MLOps are part of larger and more complex organizational digital transformations. These digital transformations also cover cloud-first and move-to-the-cloud initiatives that help to orchestrate new technical pipelines.

How do you get started with MLOps?

As you start thinking about how to apply improved MLOps operational efficiencies in your organization, allow me to provide a few pieces of insight:

  1. Define a common vision – The team needs to understand where the flagpole is located.
  2. Establish a leader –You must find a leader who understands how to lead.
  3. Identify candidate models for experimentation – Choose models that your team has defined that exhibit the highest degree of future potential.
  4. Define the operational requirements – Have a shared definition of what MLOps is and where it will live within your organization.
  5. Create visualizations (dashboards) – Make benefits tangible by evangelizing the benefits with a dashboard or visualization that allows people to understand where you are in the lifecycle of delivery and realization of that value for your MLOps initiative.
  6. Create a learning process – None of this stuff works perfectly the first time. You must provide feedback loops for learning and for the team to evolve.

It’s vital throughout the process to collaborate and work cross-functionally to engage individuals and groups that might not be technical but can provide insights based on their domain expertise.

Hopefully, you found the insights on ModelOps and MLOps useful and the discussion helped to add some clarity to a typically grey area of operational excellence.

If you found this article helpful, that’s great! Check out my books, Think Lead Disrupt and Leading with Value. They were published in early in 2021 and are available on Amazon and at http://www.datsciencecio.com/shop for author-signed copies!

Hi, I’m Peter Nichol, Data Science CIO. Have a great day!
Explaining the buzz around non-fungible tokens

If you’ve been online and surfing around some of the tech news, you’ve inevitably heard of NFTs. Today I’m going to explain what NFTs are, give some common examples of why they’re interesting, and approach the topic from a technology as well as a consumer perspective.

Hi, I’m Peter Nichol, Data Science CIO.

NFTs stands for non-fungible tokens—digital, blockchain tokens representing a physical or digital asset. Let’s get into what fungible means because that gets to the heart of NFTs. First, we’ll review what fungible and non-fungible are all about.

Fungible means that something can be replaced. Fungible things might include dollar bills, common shares, options, gold, oil, #2 yellow corn, etc. Fungibility, in this context, means that #2 yellow corn, regardless of where it’s sold, has roughly the same intrinsic value. Inversely, non-fungible implies that the object or thing in question is unique, not replaceable, or non-interchangeable. Great examples of non-fungible goods include art, baseball cards, real estate, etc. In each case, these things aren’t directly replaceable with something that’s exactly the same. However, they can be replaced with something similar, as in the case of oceanfront property. They also might hold a similar type of total cumulative value, as in the case of two old but “excellent” condition baseball cards. But, ultimately, a particular piece of land is the only piece of land in that spot with its specific attributes.

As we ponder the potential of non-fungible tokens, we realize there’s a clear benefit when you have something that’s non-fungible, unique, or non-interchangeable. Once in the form of a digital token, these items are permanently stored and recorded as proof of ownership.

We can observe the dynamics of fungibility from two differing perspectives—the seller and the buyer.

This model works well from a seller’s perspective when selling something unique and challenging to monetize. For example, we came up with a great idea for organizing our to-do lists using an AI algorithm that we developed. How would we monetize this idea? We might even have a working prototype. Squeezing out financial value from this remarkable idea will be very challenging. However, this is an excellent use case for building an NFT and selling this on a marketplace as a token. This would be one approach to monetizing the idea for investment purposes.

From a buyer’s perspective, we also have benefits. First, we have the classic benefits of supporting the original authors of assets; e.g., music, art, and ideas. Second, there are the advantages of clearly defined usage rights that often accompany the asset. Additionally, you have the right to sell or transfer as a seller, and you have immutable proof of ownership.

As you explore the use, utility, and benefits of NFTs, you should now be empowered to understand NFTs, the benefits of fungibility, and how these tokens are being leveraged to capture potential value.

If you found this article helpful, that’s great! Check out my books, Think Lead Disrupt and Leading with Value. They were published in early in 2021 and are available on Amazon and at http://www.datsciencecio.com/shop for author-signed copies!

Hi, I’m Peter Nichol, Data Science CIO. Have a great day!

Finding the right ruler to measure portfolio performance

Does your team have a clear expectation of how to win? Is the end goal absolutely defined? Probably not. Today, I’m going to offer insights on how to get your team there.

Hi, I’m Peter Nichol, Data Science CIO.

One significant leadership challenge is setting an obvious flagpole at the end of some less-than-delivered idea. Meaning, we’re trying to mature. We want to evolve. Yet, we’re not precisely at what that endpoint looks like. The result is a confused team. They don’t understand the goal. They also don’t understand the strategy to achieve the goal.

There’s a project management portfolio maturity model that I want to share with you. Our story starts with a gentleman named Ken Crawford. He’s the CEO of a company called PM Solutions. Ken has been involved in the Project Management Institute (PMI) from the beginning. In 1994, he was the President and one of the executive officers of the Project Management Institute. This was when the concept of project management was taking off globally. It was a fascinating time of explosive growth for PMI. Ken isn’t just an academic; he’s also a practitioner. He sat for the PMP exam in January 1991. He’s absolutely part of the foundation of the project management global community. It was during PMI’s Global Conference that I first met Ken. I became involved with the Project Management Institute during the late ‘90s and earned my PMP credential in 2001. Amazingly, that was 20 years ago.

Ken’s been around the block. He authored a book called Project Management Maturity Model, which was first launched in early 2001, and its third and most recent revision was released in 2015.

The book explains well how to measure the naturalization of your teams, and it dials in to the heart of how to mature your team. Think less about the projects or the products you’re working on and more about the steps you want your team to go through. Envision the process maturity that you want your team to evolve and grow into. The type of team you lead doesn’t matter. You might be a DevOps leader or driving technical solutions or embedded in business operations. It  makes no difference what your team’s trying to accomplish. Instead, pay attention to the processes your team leans on to enable success. The quality and speed of your success are directly tied to the effectiveness of those processes.

Ask yourself what degree of maturity your team is performing at today. Your team doesn’t need to strive to be the most mature (see Level 5, below). Each step doesn’t require mouse-click automation. Your team might never want to be that mature. It’s a deliberate decision, and that’s just fine. What’s not fine is leading a team with no destination. Provide your team with a vision. Give them a flagpole to race toward. Make the objective clear to everyone.

Before selecting which maturity level to target, let’s frame the maturity levels:

  • Level 1 – initial process
  • Level 2 – structured process and standards
  • Level 3 – organizational standards and institutionalized process
  • Level 4 – a managed process
  • Level 5 – an optimized process

Level 1 is the initial level. At this level, everything is ad hoc. The majority of priorities evolve from fire drills. Unfortunately, at this level, activities and work don’t always get achieved.

Level 2 begins to introduce standardized processes. Requests and processes start to be repeatable. The work gets done, but barely. Activities are mainly unplanned and not well coordinated. Getting a job over the finish line continues to be a real struggle.

Level 3 processes are not only repeatable but are starting to be absorbed into the fabric of the organization. Processes that were once team or departmentally owned aren’t part of organizational best practices. However, processes are repeatable, and individuals and teams across the organization are educated on those processes.

Level 4 is all about being managed. At this level, the organization has connected life-cycle best practices and corporate standards to corporate processes. Often, managers will suggest, “That’s not how we do it in corporate,” or, “The process doesn’t work that way.” This isn’t a great sign of leadership, but it’s a great example that you’re comfortable with Level 4.

Level 5 turns our focus to optimization. At this stage, we’re interested in tuning, improving, and optimizing existing processes.

As you define what winning looks like, factor in how to evolve your maturity continually. Measure what matters. If you were to hire a carpet installer to carpet your upstairs bedroom, you’d expect that person to measure the space with a ruler. Why? They need to define the end state; i.e., how much carpet is needed to complete the job. This seems so obvious.

Why don’t we use a ruler or similar measuring device when evaluating team performance? Eyeballing doesn’t always work and introduces communication problems. What ruler are you using? How are you doing in defining “good?” Is your target destination clear to the team? Answer those questions for your team. Next, create a ruler to measure the progress of the group. Use this ruler to define the distance between where you are and where you need to be.

If you found this article helpful, that’s great! Check out my books, Think Lead Disrupt and Leading with Value. They were published in early in 2021 and are available on Amazon and at http://www.datsciencecio.com/shop for author-signed copies!

Hi, I’m Peter Nichol, Data Science CIO. Have a great day!

How to communicate business value for maximum impact

How do you optimize a DevOps pipeline? You’ll need to get into the weeds. It’s not easy, but it’s doable. How do you streamline business operations? Even if you’re not a domain expert, somehow, you get in there and figure it out. These challenges that executives face are relatively easy to solve. Capturing organizational value is what’s hard.

There’s one question that always seems to stump executives and leaders—even myself, sometimes. The question is, what was the value provided by the team last quarter? This question causes leaders to think and reflect on what the heck they did in the prior quarter—and, more importantly, articulate the value that anybody would care about. So today, I’ll offer insights and approaches to solve this problem.

Hi, I’m Peter Nichol, Data Science CIO.

A leader I respect recently presented a simple concept in a meeting on this same subject that I thought was pretty funny. The leader started the discussion by firmly demanding, “Stop doing this! Stop cutting the lawn with scissors!” After that statement, a few slides of an individual cutting grass with scissors were flashed up on the screen. So often, we’re buried in the weeds and lose track of the bigger picture. By narrowing our focus, we lose sight of solutions that, over time, would solve our problem.

All too often, we’re buried in the details. We have daily fire drills in the hallways. We have last-minute executive decks to prepare. We have HR issues that seem to be never-ending. The result of this fast pace is that we get mired in the minutiae: we get fixated on things that don’t contribute to the bottom line. What does the bottom line mean to you? It might be focused on a triple bottom line—people, profit, and planet. On the other hand, it could be centered around driving the realization of operational goals. Maybe your bottom line is linking strategy to execution.

If I asked you to generate a two-year strategic vision, you’d collaborate with your team and come up with it. The challenge in harnessing value is it’s hard to make the concept of value realization sticky or real. Thinking about that value sometimes can be a stumper. So, what I’d like to do is provide a couple of different ideas to help you better articulate business value.

Allow me to share one example. The situation is this: You’re talking to two leaders in a conference room, and you’re separated from them by a glass wall. They’re unable to hear what you’re talking about. The great ideas you’re sharing, well, they didn’t understand any of that. This is what happens most of the time when leaders present the value their team achieved. Nobody appreciates the value because they’re not speaking in terms that other leaders understand.

Let’s empower you with some tools to make that transition a little bit more seamless. You have to keep the big picture in mind. There are three main buckets that I’d like you to think about when articulating and communicating business value:

  • The first is cost avoided.
  • The second is effort avoided.
  • The third is time avoided.

When you start to think about everything in terms of these three simple buckets, you can quantify, roll up, and articulate the business value in terms that leaders understand.

Let’s expand the concept by working through one basic example. The situation is that you’ve been assigned an initiative to streamline the executive signatures process. Today, these signatures for contracts or artifacts are signed on physical paper. Unfortunately, this results in many manual handoffs to ensure that the right leaders are in a position to sign the physical paper. In addition, logistics, geography, and work schedules make this process fraught with delays.

Over three months, your team is challenged to streamline the process and articulate the impact or business value. It sounds straightforward enough. Let’s get started!

To wrap up this initiative, you could speak with the team about process improvements or have individuals involved with the process explain their roles and contribution. This would give the team a broader understanding of the problem space, but there’s a more straightforward approach.

Let’s assume that 3,000 signatures were avoided as a result of this process improvement initiative. Great. That’s a good starting point. Now, let’s put some numbers around the time it takes to process each signature. This would involve an individual researching a contract, artifact, scope, etc. We’ll assume there’s thinking involved that these executives’ signatures aren’t rubber-stamped. We can estimate that it takes about 30 minutes to understand the contract and read it thoroughly.

Taking our 3,000 signatures times 30 minutes each results in a product of 90,000 minutes. If we divide the 90,000 by 60 to convert our minutes to hours, the resulting dividend is 1,500 hours. At this point, we want to determine the cost this reduction in approvals has achieved. We’ll assume an introductory blending rate of $100/hour to get a cost equivalent for executive time. Taking our 1,500 hours multiplied by $100/hour results in a product of $1.5MM. We did some excellent work. How do we frame this work for executive consumption?

We now have a clear understanding of the value realized:

  • $1.5MM cost avoided
  • 3,000 reduction in signatures
  • 1,500 hours avoided in non-value executive time

Our signature-modernization effect is one example of how to articulate business value. As you consider streamlining processes to discover business value, consider how you’re analyzing, articulating, and communicating business value. Keep it basic at first. Then, make sure you’re able to roll up your value proposition and present it in terms that executives understand. Finally, if you’re interested in additional methods to articulate and communicate business value, there are many great examples in my recent book titled, Leading with Value.

If you found this article helpful, that’s great! Check out my books, Think Lead Disrupt and Leading with Value. They were published in early in 2021 and are available on Amazon and at http://www.datsciencecio.com/shop for author-signed copies!

Hi, I’m Peter Nichol, Data Science CIO. Have a great day!

Shifting portfolio metrics toward strategic value

Are you running a team based on legacy metrics? Are you accountable for running a portfolio? Are you using dated or antiquated numbers to drive strategic value? I’m going to provide some insights to help you step out of that rut.

Hi, I’m Peter Nichol, Data Science CIO.

One of the biggest challenges we experience as we’re trying to optimize our portfolio is to lock down what executives really care about. What metrics do leaders want? What metrics are needed but aren’t directly asked for today? I’m here to share my insights on this topic.

Throw out your old metrics

What do leaders not care about? The cost, the time, and the effort. They aren’t concerned with the effort it takes to run an initiative. Why? Because those metrics no longer provide strategic benefits that link to strategic value. As a result, a shift in portfolio metrics is occurring.

Leaders don’t want old metrics. They demand more insightful metrics focused on new areas. Here are the questions that executives who focus on value are asking:

  • How do I maximize strategic intent?
  • Where is our culture headed?
  • What measures can we use to evaluate organizational awareness of our transformation initiatives?
  • How do we balance risk within the portfolio?

As companies pivot away from stale metrics, they’re turning toward the triple bottom line. This approach concentrates energy around people, purpose, and the planet. These concepts are top of mind as executives look for innovative methods to operationalize new concepts into their business models.

We observe this new trend emerging in many large corporations. Ben and Jerry’s is probably one of the most prominent, but you see this in Cascade Engineering, and we even see this trend taking hold within Patagonia Works. Each of these companies focuses on measures that are broader than bottom-line financial gains. They’re no longer focused on the time it takes to complete a project or the total cost involved. This pattern of interest has created a new shift in how value is measured.

We’re shifting toward value management and value optimization.

Measure what matters

What does this mean for portfolio executives championing large transformative initiatives? First, we, too, need to shift. We must change how we frame existing problems and look to new measures as we evaluate future opportunities and past portfolio performance.

Stop measuring your total active number of projects. Stop counting how many projects were completed this quarter. No one cares.

Start by measuring what’s important. Here are a few ideas to help you start down this value measure path.

  • Measure the strategic impact.
  • Measure how team norms enable the departmental vision.
  • Measure where strategic partnerships are accelerating your capabilities.
  • Measure how initiatives tie to strategic intent.

Useful but dated portfolio metrics

The metrics below add value. However, they focus primarily on legacy concepts.

  • Average cost per contractor category
  • Average $ spent by an employee
  • % of operational budget change (quarter-over-quarter)
  • $ change of operational budget (quarter-over-quarter)
  • % spend on new IT projects vs. carry-over projects
  • % of contractors dedicated to non-project work
  • $ spent on contractors working on non-project work
  • % of budget dedicated to strategic priorities
  • % of managers over total staff
  • Ratio of managers to staff
  • Average months of contractor engagements
  • Average costs per change control
  • Number of change controls by period
  • % of spend against strategic investments
  • $ spent on strategic investments
  • $ spent per employee against total departmental budget
  • Average feature-to-cycle time
  • # of releases per month
  • # of defects per release
  • # of priority shifts monthly
  • Average velocity of the team
  • % of stories planned vs. accepted
  • % of automated tests executed per release
  • # hours of backlog work estimated
  • # of PI objectives satisfied
  • $ of average initiative funded
  • % of capital invested

Modern portfolio metrics

These modern metrics help executives capture, quantify, and communicate business value:

  • % of initiatives with 95% confidence for the delivery
  • % of initiatives aligned with strategic objectives
  • # of applications not covered by third-party providers
  • # and duration of unplanned outages
  • Average age of open issues or defects
  • Average hours worked weekly by the team
  • % of project-management time spent per initiative
  • $ of cumulative value generated over last 30 days
  • % of effort spent on run activities
  • % of assigned vs. unassigned roles by initiative
  • # of resources working overtime (more than three weeks in succession)
  • Ratio of contractors to employees
  • Ratio of headcount to total spend
  • Ratio of CapEx to OpEx investments
  • % shift from CapEx to OpEx over the last quarter
  • % of contractor turnover
  • Average completion time for initiatives
  • Average contractor cost
  • Average value realized by initiative
  • # of active initiatives
  • % hours by strategic priority
  • $ of cost avoided from efficiency improvements
  • # of initiatives where IT played a leadership role
  • # of experimental initiatives in-flight exploring emerging tech
  • Total cost of ownership by business application
  • Ratio of running the business
  • Ratio of growing the business
  • Ratio of transforming the business
  • Average business partner satisfaction score
  • % of projects properly resourced at project start
  • % of terminated projects
  • % filled roles in the future-state target operating model
  • % solutions supported by existing architecture, technology, and components

Strategic decision-making metrics

Take the windows of opportunity that have previously gone untapped and understand how tactical goals can drive operational gains. This is where you’ll experience value maximization.

We know the metrics that don’t work. I’ll offer three examples of metrics that do work.

  • % of initiatives in the run phase
  • % of extra-large initiatives
  • % of new intakes over the period (month, quarter, or annually)

First is the percentage of projects that are in the run phase. This means these projects are just keeping the lights on not growing the business. They’re genuinely operational, and this highlights which initiatives are not moving your business forward.

Second is the percentage of projects, products, or extra-large interactions—whatever that means for your business. Depending on the size of your organization, extra-large could mean over $100MM or over $1MM if you’re a medium-sized company. However, if you’re a smaller organization, maybe extra-large is any work effect over $50k. The focus on the percentage of extra-large projects helps us understand how strategically aligned our initiatives are with achieving our future capabilities. It also helps define how we anticipate solving our operational challenges to support more strategic organizational change initiatives.

Third is the percentage of new intakes. This metric is defined as requests received over the previous quarter’s requests as a percentage. These metrics provide a good measure of how effectively the organization is meeting new organizational demands for further work. In addition, this measure evaluates how our growth is matched to capacity. In short, it answers the question of whether or not we need to ramp up to meet new organizational demands.

Hopefully, you’ve gained additional perspectives and insights on how to measure your portfolio more effectively. Encourage legacy leaders to let go of old metrics that don’t drive strategic conversations. Be a leader for your organization and identify new metrics to drive world-class portfolio value realization.

If you found this article helpful, that’s great! Check out my books, Think Lead Disrupt and Leading with Value. They were published in early in 2021 and are available on Amazon and at http://www.datsciencecio.com/shop for author-signed copies!

Hi, I’m Peter Nichol, Data Science CIO. Have a great day!

Building a roadmap to communicate the safe landing of your departmental objectives

Does your team have a strategy? Are they able to understand the team vision? Can they articulate how your strategy enables that vision? Probably not.

Hi, I’m Peter Nichol, Data Science CIO.

Today we’re going to talk about roadmaps. Three main components make up a solid roadmap, and all roadmaps begin with clear objectives. First, we have an objective of answering the question of what we’re trying to accomplish. The second component is measures that evaluate how effective we were in achieving those objectives. Lastly, there’s the timing. Timing addresses when all these objectives and measures will be completed or a point at which we can take a snapshot for evaluation and reflection. These are the building blocks of a roadmap. We’ll go into more detail shortly.

Do you have a strategic departmental roadmap?

You might be thinking, “Well, of course we have a roadmap.” This could be a formalized document, an idea map, or a task you wanted to achieve but never got around to completing. This is where our challenges as leaders start. Today, if you approached a person on your team and asked if they could explain your three strategic goals for the year, what would happen? In most cases, you’ll hear elements of where you wanted to go, but they won’t be formulated with the same depth and detail you’d envisioned.

Many strategies are defined but few are communicated effectively.

This challenge grows as our team sizes and departmental size expands. If your team isn’t five or 10 people but more like 500 or thousands, it’s pretty evident that those individuals aren’t going to understand your strategy.

Why is this relevant to us as leaders and executives? Team members that don’t understand the strategy can’t support or encourage others to align with it. There’s no shared mission. There’s no shared purpose. Establishing a shared mission and shared purpose is key to ensuring that leaders can efficiently deliver their objectives.

How do you start building a roadmap?

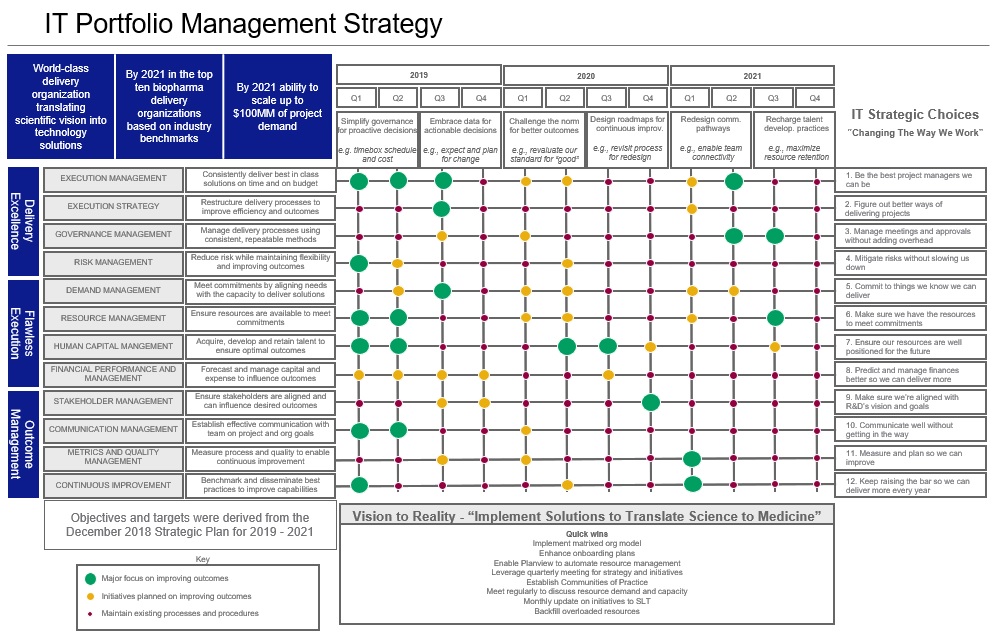
Start with the mission. What are we trying to accomplish? On the left-hand side of the illustration below, we define the three biggest priorities. You can think of these as themes or our burning imperatives. Essentially, these are the top three ideas that we, as a team, are broadly targeting to accomplish. Next are the capabilities that we’re going to enable. You can think of these as categories. Essentially, we’re trying to identify the key categories into which we’ll place the most energy. Typically, I have 12 major categories that I hyper-focus on over a three-year vision. Next are the objectives. The objective are considered general goals.

Next, we add in our timeline. Typically, I use a three-year horizon, quarterly intervals, and only focus on two goals per quarter. I’ve found that teams are unable to keep the goals quarter-over-quarter straight if more than two goals a quarter are introduced. The result is that using more goals increases confusion.

Building your roadmap

To recap, Q1/Q2 has a single goal, and Q3/Q4 has a single goal. That’s it. It’s that simple. We keep this model simple because it maintains a focus on the most critical departmental objectives, which we can measure and achieve.

The first page of our roadmap is our “strategy on a page” or our “one-pager” strategy. This is where we define the mission, themes, and capabilities. We also elaborate on the objectives, measures, and timing. This roadmap serves as a guide for resources inside and outside the department. A documented roadmap offers a clear vision of where we’re heading, what we’re trying to accomplish, and how we’re going to measure our success.

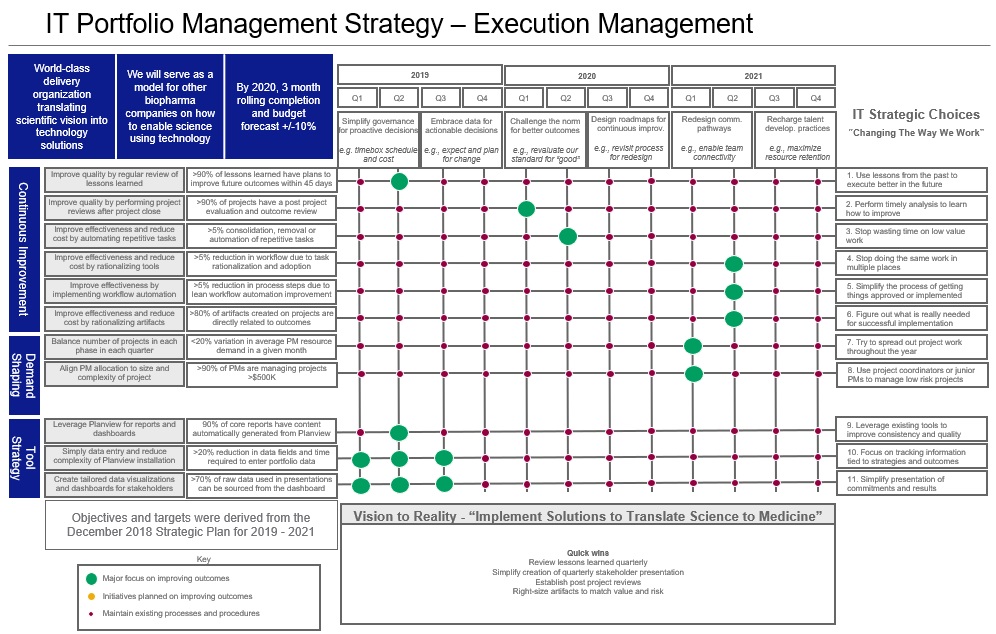
Do I only use a one-pager strategy? Not all the time. Often, you need to elaborate and explain those themes and how key results will be measured. If you need vital results or the OKRs to be measured, you’ll need additional supporting detail. You’ll need to use your judgment to determine whether your organization requires this greater level of detail. Assuming further detail is needed, you’ll probably need a second page to elaborate and expand on your one-pager strategy. But, again, this extra step isn’t always necessary.

Here’s an example of a one-pager roadmap and the supplemental detailed strategy. The second page only elaborates on the first theme but is representative of what the other themes elaborated would look like.

Illustration 1.0 – Roadmap Page 1

Illustration 2.0 – Roadmap Page 2

As you begin your roadmap journey, focus on the top three most important things: mission, themes, and capabilities. If you can make the team internalize the simple concepts of the mission and roadmap, you’re doing great. You’ve already gotten a win, and you’ve established a shared priority and a shared mission. Roadmaps often are used as a replacement for discussions, conversations, or even meetings. Use your roadmap to facilitate and centralize these conversations, not avoid them. A well-thought-out roadmap will establish a shared vision for your team. It’s amazing what happens when an entire team is pulling in the same direction!

Do you have more questions on building your roadmap? No problem. Please send me an email, and I’m happy to share more roadmap concepts with you.

If you found this article helpful, that’s great! Check out my books, Think Lead Disrupt and Leading with Value. They were published in early in 2021 and are available on Amazon and at http://www.datsciencecio.com/shop for author-signed copies!

Hi, I’m Peter Nichol, Data Science CIO. Have a great day!

Experimenting with strategic sourcing to achieve more with less

Do you think about strategy for different parts of your business? How about procurement? Does procurement have a strategy defined? Today we’re going to get into category management and discuss why dialing in this capability can be strategically impactful.

Hi, I’m Peter Nichol, Data Science CIO.

Whether you’re thinking about strategy, considering inputs, or evaluating tactics, category management offers new potential. What’s interesting about category management is that it applies a strategic focus to all the things we do with vendors. One obstacle we run up against time and time again is that we don’t have a strategic approach to managing and optimizing our procurement. In short, we have no strategic sourcing approach.

The projects we manage have roadmaps. The sprints we deliver have EPICS. The business, as usual, work in close partnership with operational goals. We have several strategic methods to manage these capabilities and ensure we’re getting what we expected. Discussing contract deliverables or pipeline value-stream rollups seems pretty straightforward regarding end-state expectations. Yet, somehow, when we pivot to the concept of source, we don’t have those same methods to measure or capture procurement-based capabilities.

The benefits of sole sourcing are vast. You go with vendors you know. You select vendors you trust. However, there are many different approaches when sourcing, whether you’re single or sole sourcing or multi-sourcing. Specifically, as we turn to category management, we’re talking about leveraging capabilities across an organization. For example, instead of five departments contracting with a vendor five separate times, category management elevates this vendor. Category management champions the idea that this vendor requires greater awareness organizationally. The simplicity of category management is that we don’t contract five times. We only contract once with that vendor. The same terms apply to all business units. We include these controls to validate that we’re receiving consistent services. These uniform contract terms ensure that we’re achieving the performance levels we’ve agreed to in the contract.

Category management elevates your sourcing game so your procurement teams can operate at a strategic level. This cuts off the tactical baggage of messy, last-minute contracts and makes our engagements and contracting more deliberate.

The greatest challenge when rolling out a category-management approach centers around delegation. As a leader, you must delegate responsibilities that today are likely performed by resources on your team. These responsibilities aren’t elevated and strategic, and they logically belong to the enterprise sourcing and procurement groups. Empower those groups to be great. After all, they’re the experts. These new responsibilities help them contract more effectively and drive strategic benefits in contracts that affect multi-teams.

Category management needs to negotiate. They might not have the experience today, but they’ll get it. They must. It doesn’t matter if you’re managing a service business or addressing SAS-type solutions. Have sourcing negotiate these. Not only will you realize better performance, but category management will be in a better position to drive SLA compliance and keep better tabs on evolving KPIs. These metrics might be new. With this revised category-management model, aggregating these metrics will be more straightforward and might include some of the following:

  • % of spend as a percent of net spend for the department
  • % net spend growth year-over-year
  • Dollars spent as a percentage of revenue
  • Total cost savings
  • Supplier fulfillment/SLA
  • Procurement-led value improvements $ (per KPIs from above), including year-on-year cost savings
  • Procurement OpEx or Cost-of-Procurement (procurement “investment”)
  • Procurement “ROI” calculated from the previous two
  • Net promoter score
  • Process metrics; e.g., cycle time, defect/rework rates, process-level productivity, etc.
  • Best-practice resource utilization and allocation
  • Value leakage (maverick spend, duplicate payments, supplier penalties, etc.)
  • Procurement staff performance and capabilities linked to skills and competencies)

Is the vendor adhering to the contract? Are deliverables being provided on time? Setting up category management establishes the foundation for using metrics to manage vendors as strategic partners proactively.

Are you interested in saving sourcing money? Are you trying to do more with less? Do you wish your vendors would bring their A-game? As you’re thinking about the next half of the year, consider how optimizing your procurement and sourcing groups can make your department more strategy-focused. Use category management as a first step toward making procurement and sourcing more strategic for your organization!

If you found this article helpful, that’s great! Check out my books, Think Lead Disrupt and Leading with Value. They were published in early in 2021, and both are available on http://www.datsciencecio.com/shop.

Hi, I’m Peter Nichol, Data Science CIO. Have a great day!

Explaining your team’s value to your business partners

Do you run a team today? Do folks know what your team provides? If you asked a business partner to name three services your team offers, could they do it? Today, I’m going to share insights on making the services you offer both internally and externally transparent to your business partners.

Hi, I’m Peter Nichol, Data Science CIO.

Companies hire new employees. Businesses partner for strategic alliances. Growth requires job expansion over what was performed yesterday. Each of these challenges leads us to one of the challenging jobs of every leader—ensure business partners understand the value our teams provide. Said another way, what services does your team provide which we might be able to consume?

What does your team offer?

There’s a funny quote from Joe Fuller, a management professor at Harvard that goes something like, “one thing I know about strategy is, it’s the assumptions that kill you, not your competition.”

I enjoy this perspective because it focuses on the assumption that people understand what you’re doing and what you’re providing in terms of value or benefits or some type of service proposition. They usually don’t.

What would happen if you ask a random person in your department what services or functions your team provides? They probably will answer with something similar to “well, you test stuff right” or “your team manages projects,” but what this tells you is they don’t understand this suite of services that you offer. What if you posed the same question to your business partners? Sure they might have a broad idea or that area your team plays in, but could they list 5 of 10 of the capabilities your team provides? I’m here to offer that they probably can’t.

Bad experiences, prevent future business

Imagine for a second that you walked into McDonald’s. Instead of looking at the menu posted on the board ahead of you, there was no menu. There was no #1 to order. You weren’t able to order a #3 super-sized. There was no menu. All you have to determine what to order is what you had overheard from friends. You might have heard that the burgers are good or that McDonald’s has good ice cream. This information could help you make a decision even with limited information. You may want to order one of these options. You’re unaware of anything else on the menu that they offer. Why? They have no menu remember.

You could have received some inaccurate information. Maybe you heard about the McPizza, McCrab, McSalad Shakers, or Mighty Wings. You might have even got excited about the summer buttery McLobster—all of which are discontinued and no longer offered at McDonald’s.

The disappointment you experienced at McDonald’s is the same disappointment your business partners felt when they didn’t fully understand the services you offered. Expecting a service you’re not available to receive is highly frustrating. If you had your heart set on a McLobster and you ended up with a double quarter pounder or some type of cheeseburger, you wouldn’t be too happy. You also wouldn’t be too thrilled about getting that same experience again. It’s challenging managing expectations of our team, not to mention the challenges when managing teams’ expectations the consume services our teams produce. Here’s how you stay ahead of this disaster.

First, understand that most people don’t know what services you provide. Second, even if they kind of know, your services—like the menu at McDonald’s—evolve.

This brings us to the need for a service catalog. Think of this more as a menu of what your business partners want, not a description of how the service is produced or manufactured.

Describe your services like this

  • New chicken sandwich in the game features a brand-new crispy, juicy, tender fillet made with all-white meat chicken
  • The melty cheese. The toasted sesame seed bun. The tangy pickle and crisp onion. And most important: the quarter pound of 100% fresh beef that’s cooked when you order.
  • Cheese Bacon burger features thick-cut Applewood smoked bacon atop a ¼ lb. of 100% fresh beef. It’s hot and deliciously juicy, seasoned with just a pinch of salt and pepper and sizzled on our flat iron grill.

Not like this

  • Support production operations with a Pitco SELV14C/14T-2/FD Solstice Reduced Oil Volume Electric Fryer System, state-of-the-art when it comes to deep-frying foods
  • The staff runs dual Vulcan EV60SS-5HT240 which have over 60” of electric range, 27.25” of cooking surface, with 5 hot tops sections and dual ovens to get your order out fast
  • Two shift managers on-site at all times, supported by 2  maintenance engineers, and 15-18 staff on-site taking orders and making food

How do you describe the services your team provides? Focus on the menu or the “what people want” not the “how it’s made.”

Specifically, I’m thinking about portfolio management. However, it doesn’t matter if you’re in cybersecurity, accountable for system testing, managing an IT infrastructure, or if you provide a sales function to your business partners. What’s important is that you can identify the key capabilities you can offer to your business partners. Group the services you can provide in some type of logical format, for example, a menu, an overview, or an outline. With this format, you have a very straightforward way for your business partners to identify and later consume services they’re interested in.

Designing your service catalog

Designing a service catalog does require core elements be covered to provide transparency around the specific service offering. Here are several items commonly found in a service catalog offering, regardless of how that catalog is presented.

  • Name and description
  • Owner
  • Customers
  • Parties involved
  • Version and revision dates
  • Service levels
  • Service conditions
  • Continuity
  • Service hours, availability & Reliability
  • Support and response times
  • Changes and exceptions

What the menu looks like

Now, you can walk into McDonald’s with a menu in hand and clearly understand what is available and what’s not available. Items might be discontinued or removed from the menu. That’s just fine because you’re looking at the latest version. When you have questions about the duration of service or the quality, a description is provided with a narrative that clarifies those details. Think about how different that experience will be for our business partners. They are less frustrated. They understand what’s possible. Their expectations are more aligned from the start.

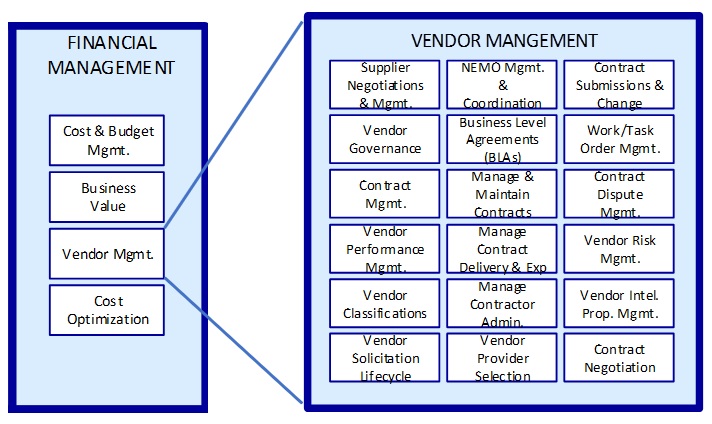
Here a high-level example of a service catalog theme. The actual services would be described in more detail and would be more juicy!

Too often, leaders don’t think of their teams as being in the service business. In reality, we’re all providing services for someone. It might be to direct customers, or the customers may be internal; everyone offers services to customers.

Consider that most of the folks which you interact with every day, if asked, don’t understand the services your team, department, or organization provides. If they don’t know what your team does, be sure they don’t know what individuals do. You, as a leader, can change that with a service catalog.

Take a minute and map out a service catalog for your team. Begin to clarify the value proposition that you offer to your business partners.

If you found this video helpful, that’s great! Check out my books, thankfully disrupt and learning with value, both available on www.datsciencecio.com.

Hi, I’m Peter Nichol, Data Science CIO. Have a great day!