Does your team have a strategy? Are they able to understand the team vision? Can they articulate how your strategy enables that vision? Probably not.
Hi, I’m Peter Nichol, Data Science CIO.
Today we’re going to talk about roadmaps. Three main components make up a solid roadmap, and all roadmaps begin with clear objectives. First, we have an objective of answering the question of what we’re trying to accomplish. The second component is measures that evaluate how effective we were in achieving those objectives. Lastly, there’s the timing. Timing addresses when all these objectives and measures will be completed or a point at which we can take a snapshot for evaluation and reflection. These are the building blocks of a roadmap. We’ll go into more detail shortly.
Do you have a strategic departmental roadmap?
You might be thinking, “Well, of course we have a roadmap.” This could be a formalized document, an idea map, or a task you wanted to achieve but never got around to completing. This is where our challenges as leaders start. Today, if you approached a person on your team and asked if they could explain your three strategic goals for the year, what would happen? In most cases, you’ll hear elements of where you wanted to go, but they won’t be formulated with the same depth and detail you’d envisioned.
Many strategies are defined but few are communicated effectively.
This challenge grows as our team sizes and departmental size expands. If your team isn’t five or 10 people but more like 500 or thousands, it’s pretty evident that those individuals aren’t going to understand your strategy.
Why is this relevant to us as leaders and executives? Team members that don’t understand the strategy can’t support or encourage others to align with it. There’s no shared mission. There’s no shared purpose. Establishing a shared mission and shared purpose is key to ensuring that leaders can efficiently deliver their objectives.
How do you start building a roadmap?
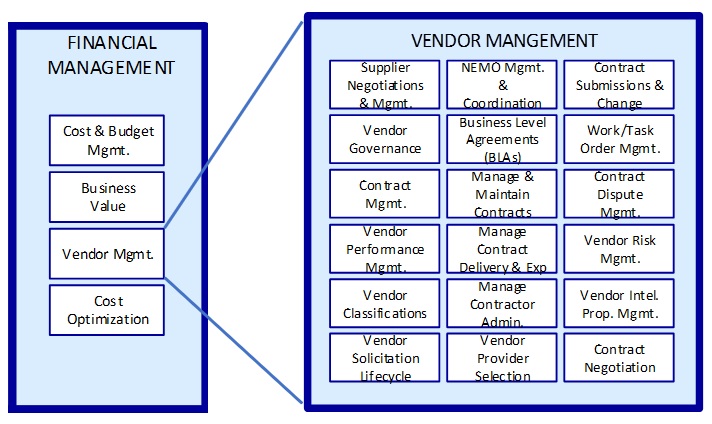
Start with the mission. What are we trying to accomplish? On the left-hand side of the illustration below, we define the three biggest priorities. You can think of these as themes or our burning imperatives. Essentially, these are the top three ideas that we, as a team, are broadly targeting to accomplish. Next are the capabilities that we’re going to enable. You can think of these as categories. Essentially, we’re trying to identify the key categories into which we’ll place the most energy. Typically, I have 12 major categories that I hyper-focus on over a three-year vision. Next are the objectives. The objective are considered general goals.
Next, we add in our timeline. Typically, I use a three-year horizon, quarterly intervals, and only focus on two goals per quarter. I’ve found that teams are unable to keep the goals quarter-over-quarter straight if more than two goals a quarter are introduced. The result is that using more goals increases confusion.
Building your roadmap
To recap, Q1/Q2 has a single goal, and Q3/Q4 has a single goal. That’s it. It’s that simple. We keep this model simple because it maintains a focus on the most critical departmental objectives, which we can measure and achieve.
The first page of our roadmap is our “strategy on a page” or our “one-pager” strategy. This is where we define the mission, themes, and capabilities. We also elaborate on the objectives, measures, and timing. This roadmap serves as a guide for resources inside and outside the department. A documented roadmap offers a clear vision of where we’re heading, what we’re trying to accomplish, and how we’re going to measure our success.
Do I only use a one-pager strategy? Not all the time. Often, you need to elaborate and explain those themes and how key results will be measured. If you need vital results or the OKRs to be measured, you’ll need additional supporting detail. You’ll need to use your judgment to determine whether your organization requires this greater level of detail. Assuming further detail is needed, you’ll probably need a second page to elaborate and expand on your one-pager strategy. But, again, this extra step isn’t always necessary.
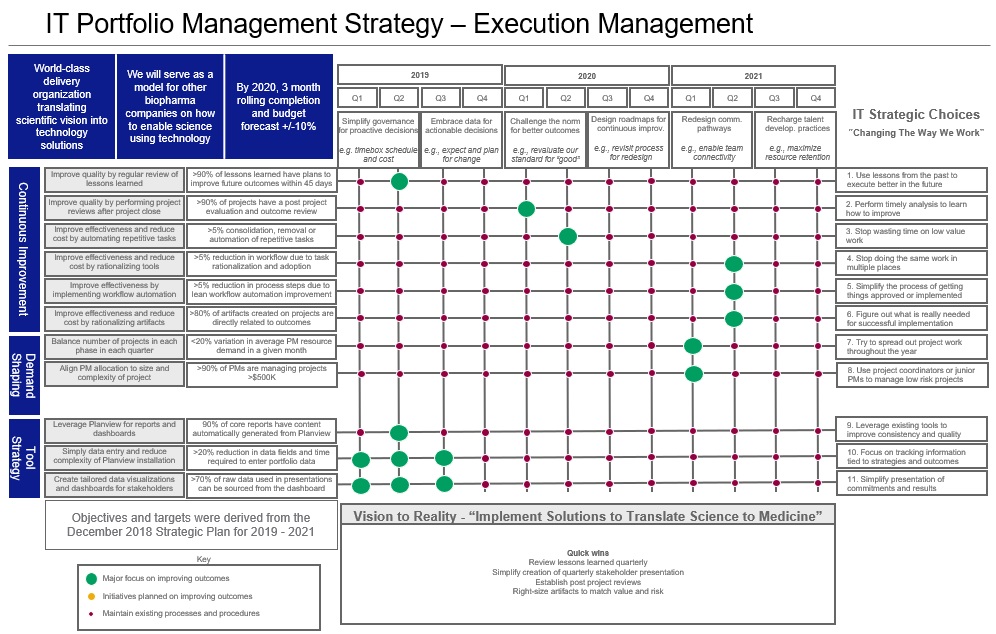
Here’s an example of a one-pager roadmap and the supplemental detailed strategy. The second page only elaborates on the first theme but is representative of what the other themes elaborated would look like.
Illustration 1.0 – Roadmap Page 1
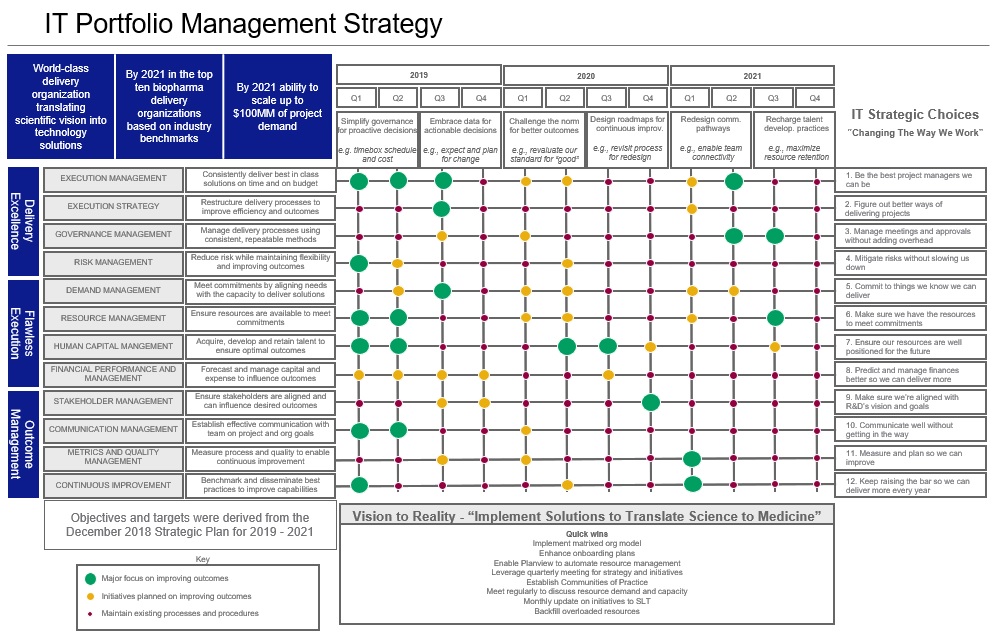
Illustration 2.0 – Roadmap Page 2
As you begin your roadmap journey, focus on the top three most important things: mission, themes, and capabilities. If you can make the team internalize the simple concepts of the mission and roadmap, you’re doing great. You’ve already gotten a win, and you’ve established a shared priority and a shared mission. Roadmaps often are used as a replacement for discussions, conversations, or even meetings. Use your roadmap to facilitate and centralize these conversations, not avoid them. A well-thought-out roadmap will establish a shared vision for your team. It’s amazing what happens when an entire team is pulling in the same direction!
Do you have more questions on building your roadmap? No problem. Please send me an email, and I’m happy to share more roadmap concepts with you.
If you found this article helpful, that’s great! Check out my books, Think Lead Disrupt and Leading with Value. They were published in early in 2021 and are available on Amazon and at http://www.datsciencecio.com/shop for author-signed copies!
Hi, I’m Peter Nichol, Data Science CIO. Have a great day!