Stop project delivery delays for good

Have you been on a project where the dates slipped? Maybe you’re using agile and, despite the team’s best efforts, dates consistently drift away from you. I plan to offer some insights today on that exact topic and how to remedy these situations.

Hi, I’m Peter Nichol, Data Science CIO.

One of the challenges with delivery is that we don’t set it up to be efficient or incentivize partners correctly. A lot of times, it’s not the team’s fault that things don’t go as planned. It’s also not the fault of the vendor. It’s usually that the contract structure doesn’t support efficient delivery, and it may include backwards incentives.

One of the most powerful concepts I’ve discovered throughout my entire career is called a delivery expectation document (DED). It sounds like a simple concept, but guess what. Almost no one uses them. Why? you ask. Because they hold everyone—especially vendors—accountable.

The purpose of a DED is to absolutely and explicitly clarify delivery expectations. It removes all doubt about what the vendor is expected to produce and how to perform. The document also specifies the format and style of what’s expected in each artifact or deliverable.

The DED is attached to the end of a contract. This attachment is essential as the final addition to the contract, and it’s part of the signed and executed official contract. There are no gentlemen’s agreements conducted after the contract is signed. DEDs are part of the formal contract.

The underlying value of a DED is that it shifts the contract focus from time and materials to linking payments to delivery.

Have you ever had a vendor tell you they won’t be able to hit a release or business go-live date? I think we’ve all been in that uncomfortable position more than once. The issue is that the vendor makes more money when delays occur. When using DEDs, we all feel that same uncomfortable feeling of not hitting our target, but the vendor eats the cost of that delay with the DED model. Vendors are incentivized to perform to the contract—because it links payment to delivery. When there’s a miss, it’s bad for everyone. This creates a shared goal for both client and contractors. This helps unify the team.

In most contracts, the payment schedule states something like there will be a monthly calendar, and on March 1, April 1, and May 1, payments will be made. The problem with this model is that payments are made and contractually required regardless of delivery. We aren’t tying payments to delivery with this old paradigm.

I recently learned that a critical project for a May 1 go-live was negatively impacted by two weeks. With less than two weeks before go-live, the vendor informed us that the delivery would be delayed two weeks. This announcement was anchored with a lot of excuses (and no reasons). Of course, this was sensitive, and I immediately started looking into the root cause and who was at the heart of this delay. What I discovered was that our vendor partners weren’t impacted at all. They all got paid on time. Shockingly, because the delivery was extended two weeks, they actually made an additional two weeks of billing for the 12 consultants engaged on that project.

Using some quick math—our 12 consultants were paid $250/hour ($3000/hour total) and multiplying that by 80 hours—I discovered that those two weeks cost us $240,000. Not only did we incur a two-week delay, which our business partners didn’t take well, we also needed to communicate that we were forecasted to now overspend $240,000 on our budget for the initiative. Needless to say, this information wasn’t well received.

As you may know, managing consultants are paid their salaries based on two primary factors. First is growth—how many new contracts dollars (net new) they sign every quarter. The second is the calculated margin on those signed contracts. In our situation, the managing consultant just increased their total net sales for the quarter. Also, given that the margins of the old contract were inflated, the vendor maintained very high margins on those two weeks of additional and unplanned work. Eventually, this work would have to be rolled into a new contract—because we’d overspend our existing contract.

If you’re not linking payments to delivery, you’re not incentivizing your strategic vendor partners to be good business partners.

The idea behind a DED is to formalize deliverable expectations and clarify the intent of the artifacts provided as part of contract delivery. I’ll share a couple of examples.

Let’s say the deliverable is a project plan. I’ve seen partners provide a simple PowerPoint document comprised of a single slide with a couple of milestones and chevrons representing generic dates claiming the project plan was delivered. Technically, this is a project plan, and, as a client, we need to continue to make payments.

We all know this level of detail doesn’t constitute a useable or reusable project plan. It’s not actionable. It’s not sufficiently detailed. By using a DED to define the project plan’s intent and what you expect as part of that delivery, you clarify expectations for all parties involved. You also don’t have to pay if that artifact isn’t useable.

When I think of a project plan, what comes to mind is an integrated project plan that captures the initiative’s end-to-end work. The plan includes the requirements to get the initiative over the line, and it concludes with a warranty. It also includes follow-up items required as part of the warranty and the post-implementation phase. It answers questions such as:

  • Who did you talk with to build this plan?
  • What departments added to the development of the plan?
  • Who contributed which sections to the plan?
  • Was the plan made in isolation by the vendor, or was it a collaborative work product?

When you elaborate through the DED sections, you begin to understand how a DED is outlined to ensure that the full intent of the document is being captured. Here’s a sample DED outline to provide a framework to define intent:

  1. Distribution of final document
  2. Introduction
  3. Purpose
  4. Scope
  5. Audience
  6. Deliverable information
  7. Document approach
  8. Document structure
  9. Document acceptance criteria

The DED identifies the intent, purpose, audience, format, structure, approval cycle, and how exceptions will be handled for that artifact. How are we going to deal with changes? Who’s going to sign off on this artifact? These questions all get addressed by a DED.

When a DED model is implemented, I’ve found there are immediate changes in the vendor partner performance. Why? Now incentives are aligned to performance.

Here are some examples of DEDs I’ve developed over the years:

  1. Automated Code Review Results DED
  2. Business and Functional Requirements DED
  3. Business Design DED
  4. Capability Maturity Assessment DED
  5. Completion of all Code Modules DED
  6. Conclusion of Warranty Period DED
  7. Configuration Management Plan DED
  8. Contingency/Recovery Plan DED
  9. Data Migration Mapping Specification DED
  10. Deployment Plan DED
  11. Design and Build of Target State Operating Model DED
  12. Design Specification DED
  13. Future and Current State Assessment DED
  14. Operational Support Plan DED
  15. Operations and Maintenance Manual DED
  16. Organizational Readiness Plan DED
  17. Project Management Plan DED
  18. Project Schedule DED
  19. Release Plan DED
  20. Requirements Validation and Prioritization DED
  21. Security Plan DED
  22. SIT Test Plan DED
  23. System Acceptance Plan DED
  24. System Design Document DED
  25. Technical Design DED
  26. Training Plan DED
  27. Transition and Knowledge Transfer Plan DED
  28. Wireframes DED

Instead of having that delay and trying to convince the vendor to find a way to deliver on the May 1 date we require, they’re fully incentivized to ensure they deliver on time.

Now, sometimes, situational or environmental factors prevent delivery. This could be a delay in the business leader’s availability or a delay in receiving a critical product or a supplier delay. Things happen in life and in business, and it’s important to be reasonable. In these cases, you work together as partners and figure it out. However, for most situations, you want that vendor partner incentivized to deliver on time or even early.

When you tie payments to delivery by leveraging the DED model, things start to happen. Do you wonder why you have project delays and then more delays? Are you curious why agile really isn’t making the waves you anticipated and why you consistently have to push out timelines? You might want to consider implementing a deliverable expectation document (DED) approach in your contract lifecycle.

If you’re interested in a sample DED, send me an instant message on LinkedIn; I’d be happy to share an example with you. Hi, I’m Peter Nichol, Data Science CIO. Have a great week!

How to stretch your workday by 20%

Is the executive leader you support especially busy? Does that leader not have time to attend all the meetings they’re supposed to participate in? I have some insights for you.

Hi, I’m Peter Nichol, Data Science CIO.

One of the challenges we all experience is that we’re over-committed. We have too many meetings and too many things to do, and there are only so many hours in the day to get all those tasks completed.

One of the techniques I used just last week was to optimize my supervisor’s time by reviewing our communication model’s effectiveness; i.e., I assessed the meetings we attend. Often, we step into new teams, or we’re on a team, and we assume the status quo is acceptable. There are X number of meetings we have to attend. We don’t look at optimizing our communications. We’re too busy running from meeting to meeting.

It’s a wise idea, every so often—whether that’s monthly or quarterly—to assess the meetings you’re participating in. Ask yourself if you’re making decisions in those meetings, or would an email suffice. Is it possible that sending out an email update would generate similar awareness to attending a meeting? Ask yourself, “Am I required to be at this meeting because I’m making active decisions?”

One technique I developed over the years is to continually reassess my communication effectiveness and the effectiveness of meetings for executives I support.

  1. Start by making a list of all the meetings that your supervisor (CFO, CIO, CTO) attends in which you’re also in attendance. There may be 20 or 30 meetings per week that both you and your supervisor jointly attend. It’s probably not required that you both attend every one of these meetings.
  2. Make a list of who’s usually in attendance at these meetings and identify who’s making decisions.
  3. Then, classify these meetings into two groups: Group A meetings are meetings that the supervisor must attend. Group B meetings are meetings you can take over and provide updates in writing post-meeting. This follow-up could be in the form of a simple, bulleted email or be more formal, such as complete meeting minutes. The goal is to alleviate the burden of that leader by attending some or all of these meetings.

Taking this approach has two main benefits. First, it elevates your role in the environment and offers you some additional visibility as you attend these executive-level discussions. Secondarily, it helps free your supervisor from attending non-value-added meetings.

After making a list of meetings, I discovered there were almost 25 meetings that my supervisor and I both attended. Many discussions were deemed to be necessary and couldn’t be flat-out canceled. Each one of these was a meeting in which decisions were being made. However, after a more detailed analysis, I discovered that we didn’t both need to attend every meeting.

As a result of that analysis, I was able to offload most of those meetings from my supervisor. I then quantified how many meetings occur, whether they’re weekly, daily, bi-weekly, monthly, or whatever, and started to total up those meetings. The result was I had a common denominator of how many total meetings we had that overlapped. Then I took all the meetings and calculated the monthly time that each one consumed. This created an “hours per month” metric that was common and relatively generic. This allowed me to quantify and compare apples to apples in terms of savings and, ultimately, the hours avoided.

Maybe you can’t free up the supervisor’s time for all the meetings you both jointly attend. However, if you could eliminate even half of those meetings and free up 15 or 20 hours a week, that’s almost 50% of the time. Maybe, you’re unable to gain that degree of efficiency, and you’re not avoiding 20 hours a week; perhaps it’s more like 20 hours a month. Even so, that’s a lot of freed-up time for an executive to use to focus on more strategic initiatives. This enables the leader to spend more time planning, thinking, and being more strategic. If your supervisor isn’t in the weeds, they’re going to be thinking ahead and removing roadblocks for your department.

Interested in an example of how these concepts are applied? Here are the before-and-after results of an exercise I conducted recently with a senior leader:

The facts

  • 28 meetings analyzed
  • 12.78 average people in each meeting
  • 2-41: the range of meeting attendees
  • 24 total meetings monthly
  • 42.4 hours in meetings monthly

The results

  • 12 total meetings avoided monthly
  • 32.4 total hours avoided monthly
  • 50.0% of meetings avoided
  • 76.4% of hours avoided
  • 144 total meetings avoided annually
  • 388.8 total hours avoided annually
  • $58,320 in cost avoided annually

As you jump into the new week, start by reflecting on the communication styles you’ve enabled, and count the meetings you’re attending each week. Think for a second, and ask yourself, “Am I needed in this meeting? Are there meetings my supervisor and I both attend that I could pick up to make his life or her life a little bit easier?”

Hi, I’m Peter Nichol, Data Science CIO. Have a great week!

Uncovering the root cause of poor team performance

Is your team struggling to perform, and you’re not sure what’s going on? Are you having challenges with delivery, but you can’t put your finger on the problem? I’m going to provide some insights to help answer these questions.

Hi, I’m Peter Nichol, Data Science CIO.

One of the challenges we experience as executive leaders is that we focus on all the qualifiable delivery aspects. For example, we concentrate on the number of product launches, the number of projects delivered, or the number of sprints deployed. In doing this, we forget about the softer side of delivery; i.e., the values, beliefs, and behaviors the team embraces to enable delivery and achieve successful outcomes.

I want to share a couple of ideas that will help you as a leader. These techniques allow you to dial in to the softer side of delivery and assess what’s required for your team to win. This will give you the confidence to know whether the team is performing or not. These assessments and maturity tools are available to professional members with training provided by the BRM Institute.

The first idea is a business value ability assessment. This assessment helps to measure maturity and determine whether you’re connecting behaviors to outcomes. It determines where your team is from a maturity perspective:

  • Sporadic: occasionally does stuff to identify value
  • Definable: usually performs steps to capture value
  • Attainable: always takes steps to understand the value
  • Optimized: focus on dialing in and quantifying the business value

The assessment allows leaders to get a better framework of which behaviors and social aspects drive and contribute to successful team deliveries.

The second assessment is called a cultural readiness assessment. This assessment asks questions that help narrow down which internal and external factors impact your delivery and your delivery success.

The assessment focuses on stimulating, surfacing, and shaping business value. The questions help identify the values, beliefs, and behaviors that your team is enabling. The assessment answers the question, Is the team using the right behaviors to enable the outcomes? Questions uncover not just what outcomes were achieved but how they were achieved.

For example, a question might probe into budgeting and explore not whether the team is budgeting but how that’s being done; i.e., from the top down or the bottom up. The question won’t ask whether the team is successful. It will filter out the behaviors driving performance and similarly ask whether those behaviors are healthy. Another question might explore whether the team celebrates successes and then immediately asks whether failures are also celebrated. A question won’t simply ask how team members rise to be leaders but rather how those leaders are elevated.

When you go through these exercises, you discover that the results uncover correlations and causations between team behaviors, performance, and outcomes. From this assessment, we, as leaders, begin to understand the softer side of delivery.

Hopefully, you can experiment with a couple of techniques and discover if they can work for you. If you’re interested in more details, I’ll put a link in the post so you can get some additional information from datasciencecio.com.

Hi, I’m Peter Nichol, Data Science CIO. Have a great day!

Surprisingly small shifts that can improve your productivity

Do you take time to identify tasks you have to complete for the following day or week? A lot of us do. Is it working for you, though? I want to present some alternative approaches.

Hi, I’m Peter Nichol, Data Science CIO.

How do you start your week? What method or approach do you take to ensure you meet your daily, weekly, or monthly objectives? Many of us sit down and try to articulate what activities we have to focus on or complete for the week, and that’s pretty normal. The challenge is that this gives us a false sense of productivity. For example, if we have 15 tasks and complete 10, we think, “Wow, I’m two-thirds of the way through, or 66 percent complete, with those initiatives.” But the reality is, we didn’t weigh those to-do list tasks based on either priority or the time it takes to achieve them. As a result, while 10 of 15 activities may be completed, 70% of the time required to complete all the tasks falls on the remaining five uncompleted tasks. This is why we feel a false sense of productivity.

There’s a new approach I’d like to present. This idea begins with a premise built around procrastination. When we think of procrastination, a lot of images fill our minds. We think of somebody lounging on a couch and eating a bag of chips or vegging out watching Netflix. The individual could even actively walk around the house while snacking but not accomplishing their target goals. These are common images that come to mind when thinking about the concept of procrastination.

There’s another side of procrastination, however, and it’s called productive procrastination. The idea behind productive procrastination is that you’re doing something, but it isn’t adding to what you’re trying to accomplish. Some examples might be attending meetings. In theory, you’re busy because you have back-to-back meetings all day. However, when you look at what you’ve accomplished at the end of the day, you haven’t made any real progress on your goals or objectives.

Another example is performing busywork. The work is independent and doesn’t require you to collaborate or work with a team. You might be updating a spreadsheet or drafting an executive brief. These are activities you need to complete. The catch here is that you end up spending extra time on these activities because they’re easy and can be performed without others’ involvement. Time spent on these activities can be slightly helpful, but they ultimately don’t get you closer to your primary objective for the day. It’s important to note here that while you feel you’re being productive, you aren’t.

Brian Tracy, a productivity and self-development author, came up with a new concept to address this exact problem. It’s called the A-B-C-D-E method. Using this method, Brian prioritizes activities on a spectrum of the most critical to the least important and then identifies actions he can eliminate. He performs the A-B-C-D-E method every day.

  • A activities: activities that must be completed and have a hard deadline.
  • B activities: essential, but they don’t necessarily have a hard date for achieving them.
  • C activities: typically what we spend most of our time on. These activities don’t have a target date, and they might be necessary or might not. But, ultimately, they’re straightforward to complete. As a result, we spend a lot of time feeling great when completing C-level activities.
  • D activities: activities that don’t belong anywhere. They don’t have a priority. They don’t have a hard deadline. These are generally considered nice-to-have-completed activities.
  • E activities: tasks or to-do items we want to eliminate. Often, when we spend time on E activities, we aren’t completing tasks. Instead, we’re working to identify how to free up our time. Maybe we can delegate the job to a team leader or subordinate. E activities can also be tasks we choose to automate, such as daily reporting, status reports, or health checks.

Think about using the A-B-C-D-E method to prioritize your activities for the week. You might even gain some productivity!

Hi, I’m Peter Nichol, Data Science CIO. Have a great week!

The single best productivity hack for managing remote teams

How are you managing your remote teams and ensuring that they’re at the maximum level of productivity? Today I’m going to provide some insights on that topic.

Hi, I’m Peter Nichol, Data Science CIO.

Recently, we talked about the Ivy Lee Method, which ensures productivity on a team by focusing on individual performance. The method centers on six key activities. It’s similar to a to-do list but is limited to six items that must be completed during that day to maximize productivity. These items are also weighted from most important (one) to least important (six). Suppose you do complete all six items in a given day. That’s great. The following day, you generate six new priorities to focus on. If, however, any of the six things aren’t completed that day, they’re rolled into the next day in order of importance, and these items are completed in order of priority.

Today, I want to share my insights on a leadership technique that I’ve been using for years. I’ve found the results compelling. It’s also a great tool to leverage when working in a remote environment with global teams. It’s called the Top 5. It originated, in part, from the Ivy Lee Method; however, instead of six priority items, the Top 5 focuses on five significant classifications of work:

  1. Top five issues you’re facing (e.g., project-related start with project name)
  2. Top five business partner updates (i.e., scientists, stakeholders, and internal or external customers)
  3. Top five accomplishments
  4. Top five accomplishments planned for the following week
  5. Project or product status

Now, let me go through each of these quickly.

First, we have issues. These aren’t the typical issues you’d find in a risk register or a public-risk tracker. These items are the quiet and unheard issues that create team dysfunction. They include personal disagreements among individuals and political aspects impacting team performance. These issues are never going to make it into an official risk log. This is why the concept is so powerful. You, as a leader and a supervisor, need to understand what’s genuinely creating obstacles that prevent your team from performing at their maximum level.

Second are business partners. This section tells me what I’ll hear if I get a call from a business partner or a customer. Am I going to hear something positive? Did something happen that will create friction; e.g., a poorly run meeting, deadline missed, resource performance problems, etc. Regardless, I want to know how that conversation will unfold, and I want some talking points before I receive a call. This helps me stay on top of the latest business-facing concerns.

The third classification is accomplishments. What did the team complete last period? I don’t care what the manager or leader did. I care about the team results and the leader driving the team results.

Fourth is accomplishments planned for the following week. This step forces the individual to think ahead and anticipate change. If items are missed (this is similar to the Ivy Lee Method), they roll along to the following week. This helps to narrow in on soft delays. These are last-task completions, but they don’t necessarily impact the project’s go-live.

Fifth is the product or project status. I’ll go into more depth in another article about activity status because it’s a bit more complicated. This section has three main areas:

  1. 5’ONs: Schedule, scope, quality, value, budget
  2. Red, amber, green
  3. Comments

The 5’ONs are either “ON” or “OFF.” If they’re ON and green, that’s great. However, any of the 5’ONs that are red or amber require an open issue to be logged. The individual can determine if a risk is created or not. However, at least one single issue must be created to show how the item is driving the status. For example, if the schedule is OFF and amber, this is how that line item would read:

  • Schedule (A): Issue 199234. Based on initial timelines, the schedule may be impacted by two weeks for the SOW approval delays.

This tells me the schedule is impacted, there are action and mitigation plans in place, and it identifies that, if resolved, these would bring the project back to green. Think what getting the project back on track looks like or, said another way, think about “the road to green.”

Leveraging these five buckets allows the team to focus on the burning imperatives. It also removes the need for the leader to be a micromanager. Teams hate being micromanaged, and as managers, supervisors, and executives, we hate micromanaging. Yes, sometimes it’s a necessity. However, generally, this approach affords the leader a bird’s eye view of how the team is performing.

The Top 5 solves these questions:

  • Which individuals need support?
  • How can I, as a leader, be most impactful for my team?
  • What obstacles does my team need me to remove?

As you run Top 5 weekly reports with your team, you’ll quickly find patterns and common issues among individuals’ Top 5’s. There will be overlap, and there will be similarities. This is precisely what you’re looking for—common themes that are affecting not one leader on your team but many. These are the core challenges that you, as an executive, need to spend your time resolving. For you, as a leader, this removes the guesswork, because you now know exactly where to get involved. This ensures you’re removing the most critical roadblocks first and keeping your team performing at their best.

Think for a minute as you jump into this new week: Do you have a clear understanding of the roadblocks your team is experiencing? If you can’t answer which roadblocks that surfaced last week are common to more than three team members, you might want to consider implementing a Top 5.

If you’re interested in receiving a copy of a sample Top 5, no problem. Please message me on LinkedIn, and I’ll be happy to share an example with you.

I’ll offer up an additional idea regarding managing and leading remote teams. It’s called a WHIP.

Q: What’s the number-one problem with remote teams? A: Engagement.

A WHIP solves this challenge. Here’s how it works. Let’s say you have 15 people on the team. You queue up an idea—for example, “What’s the single most-impactful change we could make for 2021?” Then you allow each member of the team 30 seconds or less (timeboxed) to offer their idea. If they can’t come up with something in three or four seconds, they’re skipped and you WHIP around them and circle back at the end.

Why does this work? It works because it forces people to think of answers they don’t have—unlike, “Tell me about your last product meeting,” which is about memory recall. This method requires zero preparation time. A WHIP is a new idea that takes a minute to think about. It goes without saying that no ideas can be repeated within the WHIP session.

Are you looking for better engagement during your next remote team meeting? Try a WHIP!

Curious about what the Top 5 template looks like? Download it here.

Hi, I’m Peter Nichol, Data Science CIO. If you liked this article, please like or comment below, and have a great week!

Spend more time playing and less time working with this productivity hack

Are you trying to figure out the next productivity hack? Interested in discovering a way you can improve? Curious how to accelerate how much time you have every day?

I want to share something that I’ve used for many years. This method is the main reason I’m so productive; why can I write more every day, create more content, and ultimately spend time doing the things I love like sailing, flying planes, and scuba diving.

Hi, I’m Peter Nichol, Data Science CIO. Today we’re going to talk about different approaches to improve your productivity. In the 1990s, Charles Schwab was trying to come up with ideas to help his management team. At the time, he was president of Bethlehem Steel out of Bethlehem, Pennsylvania, an extensive production facility producing steel for the military and many other operations.

He was trying to figure out that next productivity hack. When brainstorming, he decided to reach his old friend, John D. Rockefeller, Senior, and asked for suggestions. John referred him to a gentleman named Ivy Ledbetter Lee. Lee was known more as a public relations specialist. However, he also had built a reputation as a productivity expert. Charles asked Lee to come to the PA plant and work with his management team. Lee interviewed Schwab’s management team and only spent 15 minutes with each team member. Once Lee was done, he provided each executive with a single tool. Later, Schwab discovered that Lee introduced each team member into what later will be known as the Ivy Lee Method. This is an approach to keep hyper-focused on your top priorities.

The concept was beautifully simple, write down your top six priorities and do them every day. If you only could get six items done each day, what would they be? This latest dovetailed into Tim Ferris’s concept, asking, “What would you do at work if you only had two hours a day.”

Lee suggested each executive work their list top-down (1 through to 6) in order of priority. Completing the most important item first, then the next most important, and so on. Distractions are a reality in any environment. The higher your seniority the more frequent fire drills pop up that are unexpected and critical. If you did not complete your list of six items at the end of the day, those items roll forward onto your list for tomorrow. If you did complete all six things, you would create a new list of six things for the following day. This method keeps the focus on the items that add the most impact to your day.

The method allows leaders to focus on their work’s most critical aspects while spending less time on the least essential elements. We often apply the Pareto 80:20 rule, where 20% of the activities provide 80% of the value. Unfortunately, we often focus on that 80% because these are the low-hanging fruit items. They typically more tactical, and usually, they can be completed independently. As a result, this makes these tasks easy to complete. Yet, they don’t always provide the most value. This is where the Ivy Lee Method comes into play.

If you can apply this method to your daily activities, what you’ll find is you slowly increase productivity. Of course, dramatic transformations don’t occur overnight, but over months and years, it’s unbelievable how much more productive you’ll be. As you think about what you want to accomplish this week that will keep you on track for your quarterly goals, consider using the Ivy Lee Method. Begin with the top six most important items, and if you get those completed, great work on the following six.

Hi, I’m Peter Nichol, Data Science CIO. Have a great week!

Applying predictive analytics to lock in year-end success

Can you answer the following questions?

  1. Do you know your quarterly results?
  2. Do you know how your team is performing?
  3. Which aspects of your plan are working out great and which aren’t exactly running according to your goals? Is your team getting it done?
  4. How is financial performance trending for your organization or department?
  5. Are business issues being resolved, or is that debt growing?
  6. What does your year-end look like based on your performance?

I’m going to share some insights to help you answer these questions.

Hi, I’m Peter Nichol, Data Science CIO.

Today we’re going to talk about predictive analytics, but this might not be what you think it is. We’re not going to cover digital asset twins, where we try to understand digital sources’ physical properties. Operational digital twins are out of scope in this article, too. Operational digital twins have to do with digitizing the supply chain. Future digital twins are also not part of our discussion. We’re usually looking at real-time streaming information and using computational models to help understand neural networks.

What we are going to talk about is a simple, predictive-analytics example applied to day-to-day business operations. Let’s shift away from model discovery, asset management, and risk management into a practical design that works. We’ll explore a model I’ve been using for years that’s highly impactful. Here’s how it works.

Every day and every quarter, we try to predict future outcomes. We try to use predictive analytics to offer insights into future events based on previous events. We know our results from yesterday. We know our results today. In theory, can’t we predict our performance for tomorrow, next week, or next month? Yes, we can. That’s precisely what we’re going to do in this discussion.

Here’s the good news. You don’t need Minitab. You’re not going to need the IBM SPSS Statistics package or Rstudio, JMP, or even OriginPro. Excel will work just fine (although all those tools are compelling when applied to a suitable problem space).

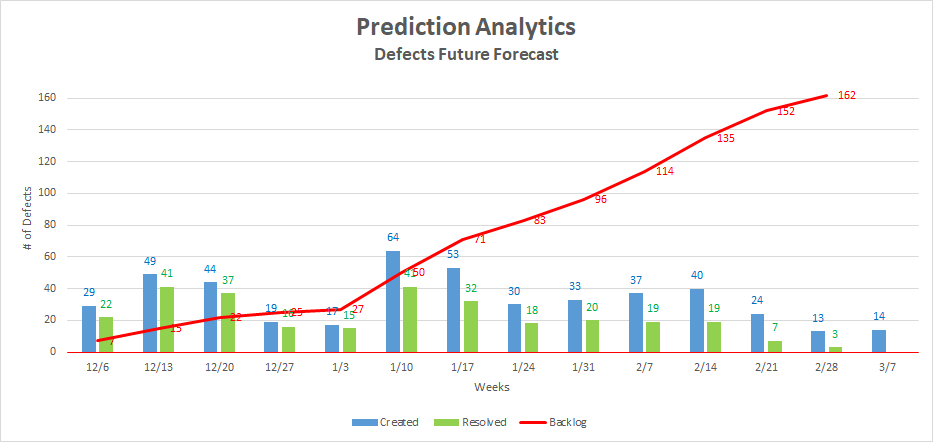
This simple application is in the form of a side-by-side bar chart with a cumulative trend line. The first will model financial variance, and the second will be leveraged to predict trending rates and identify abnormalities.

Financial variance model

Our problem statement is that we’re attempting to model our future financial variance based on historical information. While this is far from a perfect model, the principle is that historical performance will be an indicator of future performance. Essentially, we want to answer this question: If we stay on the current path, what will be our financial variance at year-end?

We start with a model of our planned spend monthly and roll that up to our annual forecast or budget. Hopefully, this isn’t a flatline model—i.e., $1 million a month that’s flatlined—as this model assumes that every month is equivalent, which is rarely the case. We need to consider environmental variances, the cyclical nature of payment schedules, and other inherent business operations challenges. We need to look at each month separately. Once you have that number, it will be your forecasted spend.

Every month, the books will eventually close, and we’ll have actuals for that prior month—the actual spend. We now can chart these two values per month in a side-by-side bar chart to visually depict the variation.

On top of these bars, we’ll overlay a trend line representing the cumulative variance over time. For example, let’s say our January forecasted spend was $1MM and our actual spend was $800k; we have a variance of $200k that will go into the trend line. In February, if our forecast is $1.2MM and our actual spend is $1.0MM, we have another $200k variance. In this model, the February trend line would be $400k ($200k + 200k), and so on. This visualization immediately shows whether we’re heading toward our objective of low variance or if our variance is growing. This allows us, as an executive, to immediately take corrective action before the year-end numbers are locked down. Similarly, we can use this same model to chart variations and adherence and see how close we’ll be at the target end for multiple variables including defects, disputes, sprints, features, enhancements, product launches, etc.

Defect variance model

We can use our same model to chart variations and adherence for defects. The model is applied in this way: Our problem statement, in this case, is: How many defects will we have at year-end? We use a forecasted model to determine how many defects we think will be created per month. One bar chart will be defects created. We’ll also track how many actual defects were resolved each month. We’ll label these defects resolved. Similar to the model above, we’ll chart these two values monthly, side-by-side. Then we’ll use the cumulative delta—i.e., defects not closed or additional defects burned down over our target—as our trend line. This trend line now becomes our backlog.

Whether we’re accumulating 2,300 issues a month, 50 issues a month, or whatever it is, we can quickly identify a trend. It’s straightforward to see the trend because the trend line is either increasing or decreasing. The result is we’re able to perform and predict the difference in future outcomes. Are we heading in the right direction, or are we not?

By applying these simple techniques, you’ll have a powerful tool to anticipate the business and operational changes required to ensure that your department posts outstanding year-end results.

Hi, I’m Peter Nichol, Data Science CIO. Have a great week! Cheers.

Chart 1.0 Prediction Trend

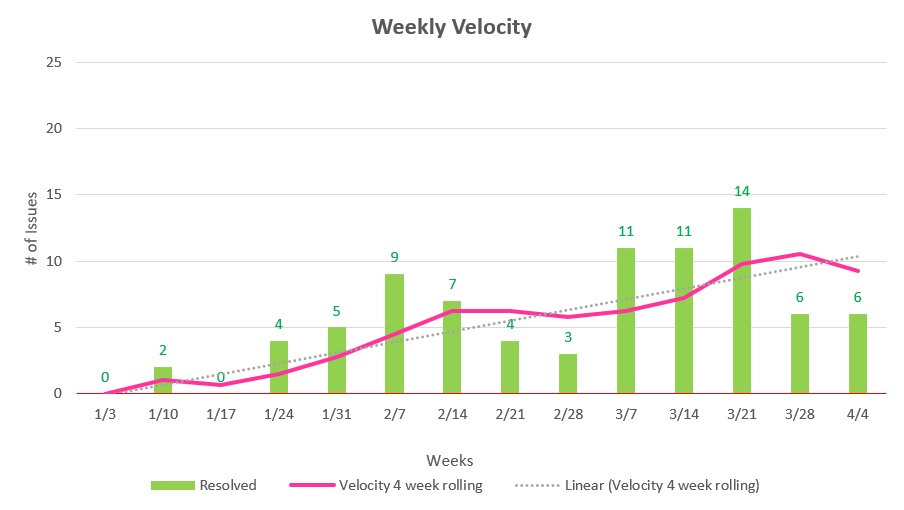
Chart 2.0 Team Velocity

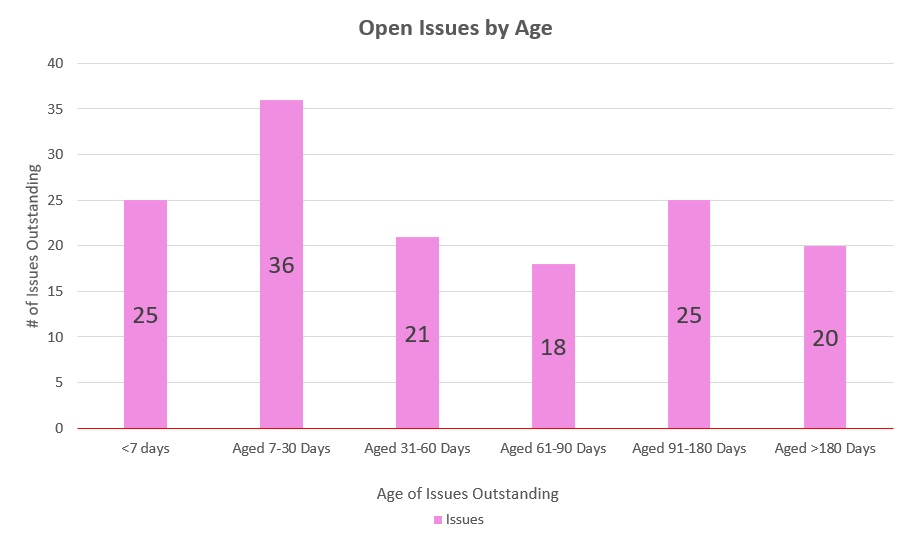
Chart 3.0 Open Issues by Age

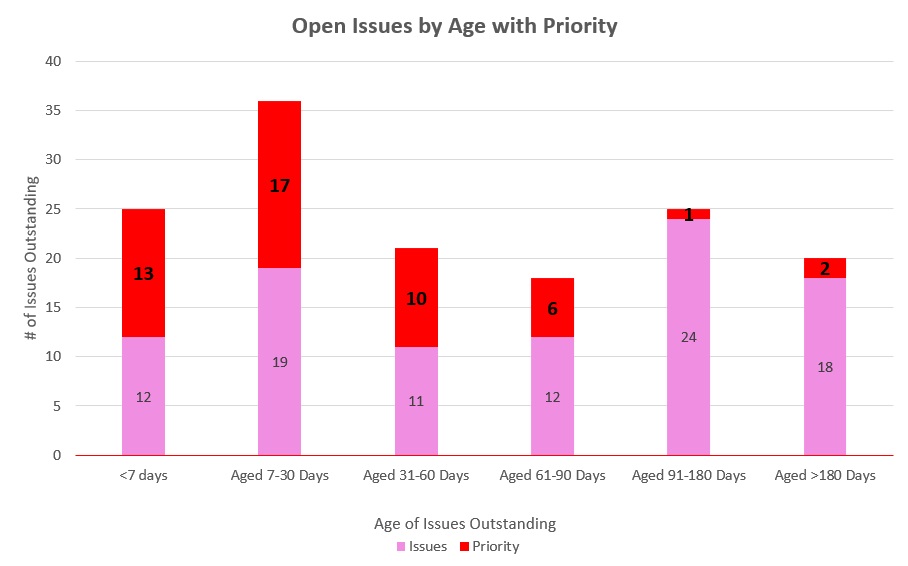
Chart 4.0 Open Issues by Age with Priority

Breaking into data science

Are you an executive who’s trying to break into the data-science space? Are you a project or program manager running a large operation and attempting to figure out how to get more involved in data science? I’m going to provide some insights.

Hi, I’m Peter Nichol, Data Science CIO.

Today, we’re going to focus on what data science is, the typical areas of data science, and how to get involved in untapped opportunities. Let’s get into it.

What is data science? Data science utilizes the scientific method to better understand how to use algorithms and other inferences applied to structured and unstructured data to generate insights. We’re talking about data and trying to get insights from that data.

Conventionally, there are five significant areas in data science:

  1. Computer science
  2. Data technology
  3. Data visualization
  4. Statistics
  5. Mathematics

First, we have computer science, the study of computations and information. Second is data technology, which focuses on data that’s derived from machines and humans. Third, data visualization offers the graphical representation of data and other aspects to provide insights. Fourth is statistics, which is a summary of information that typically provides conclusions on data. Fifth, we have mathematics, comprising the study of logic and the reason behind a lot of data-based decisions.

You might be thinking, “I don’t really have a background in dimensionality reduction or P values,” or maybe you can’t recall Bayes’ theorem off the top of your head. Perhaps your sampling techniques aren’t on the bleeding edge of technology innovation. That’s okay. Much of data science has nothing to do with those aspects but is just as critical.

One area of data science that’s rarely discussed is vendor management. When I speak to many world leaders—from those pioneering logistics to those running biotechnology companies—there’s one underlying theme that’s always present: Nobody has the money to hire an army of folks to go out and generate all these new insights. Hiring data scientists and data analytics leaders is expensive. Many companies don’t even have a formal Chief Data Officer. In many cases, data-science resources—even if you do have the funding for them—are difficult to source and hire because they’re niche to specific domains.

Even knowledge-data resources on your teams today likely don’t have the deep expertise required to make sustainable data-analytics transformations. So, what happens? As executives, we have to engage other types of leaders and partner with other companies to improvise these internal capabilities. In short, we contract out capability needs, usually in the form of fixed-price contracts. This model introduces new skills where we have additional gaps.

We require leaders who understand vendor management. Specifically, we need resources with general-vendor and contract-management experience and well as expertise in contract terms, sourcing, and category management. We also need experience contracting and leading the procurement activities of data-specific initiatives. These types of questions might help to determine if you have that necessary experience:

  1. Do you have experience negotiating vendor contracts?
  2. Are you comfortable identifying players in a niche domain space; e.g., vendors that do data ingestion and data governance, vendors that integrate with Snowflake or other data-lake solutions, etc.?
  3. Can you facilitate discussions to help narrow down potential vendors based on limited requirements?
  4. Do you have experience with data-driven contracts?
  5. Have you contracted for cloud compute and cloud storage services provided by third-party vendors? Are you comfortable with the terms and conditions of these types of contracts?
  6. Are you familiar with cloud-based data-transfer costs and approaches to control or limit cost overruns?
  7. Have you previously drafted a contract for data services or data-enablement initiatives?

We require resources that can internalize and enable organizational capabilities around data science, data insights, or data analytics. If you have a background in vendor management and are curious about data science, explore the untapped area that many leaders don’t want to talk about—vendor management.

Resources that are able to join teams, quickly come up to speed, and build capabilities by leveraging third-party partners are priceless. You might even have experience working with consulting companies or data-specific vendors with deep expertise. This works too.

Typically, executives don’t have the luxury of fat budgets to bring in 20 resources permanently to address data demands. To fulfill the growing asks that are pushing against our data enablement teams, we need to expand our capabilities. Usually, this means creative contracting.

To meet our business partners’ enormous data demands, we need to get creative, strategize, and find data-literate partners. The best tip I can offer is that, if you’re interested in learning more about data science or data-science capabilities, focus on the business’s vendor-management side. This is a crucial shared priority for the CIO and the CFO. Data-vendor management is here to stay and has vast untapped potential.

Hi, I’m Peter Nichol, Data Science CIO. Have a great day!

Discover the untapped potential of DataOps

Is DataOps the same as DevOps? It’s not, and I’m going to explain why.

Hi, I’m Peter Nichol, Data Science CIO.

One of the challenges we see with development operations (“DevOps”) is that folks don’t understand what it means. The term is becoming more and more popular, so I thought I’d take a minute to explain it. DevOps is a lot different than DataOps. DataOps focuses on automation. It’s a process-oriented methodology that data-science teams use to simplify or streamline a data-science workflow, typically generating analytics. Where did the concept of DataOps originate?

It came from Edward Deming, an American engineer, statistician, professor, author, lecturer, and management consultant. He’s also referred to as “the father of quality.” In general, he focused on quality and production control and, more specifically, on the area of statistical process control. If we look at DataOps—specifically the role of DevOps—we start to understand what DataOps is all about.

Let’s break down what DataOps means. The foundation of DataOps has three main principles.

First, DevOps is focused on the delivery and development of some entity. Second, it’s based on agile—commonly applied to software development—and on the Theory of Constraints, which centers around removing obstacles and trying to take the shortest path to achieve an outcome. Third, DataOps is made up of lean manufacturing principles. Lean manufacturing emphasizes quality and production efficiency and uses statistical process control to monitor and control process variance or deviations.

Okay, now that you understand the foundation, where’s this going? When we start to think about value and how it comes into the picture, we can add a data factory or data-orchestration concept. The benefit of data operations is that it’s not only the outcome that we’re looking for—i.e., a validated analytical model with visuals—but we’re also making sure the data goes into the process correctly. We focus on the throughput as well—what’s happening with that data and information as they translate through the model.

Lastly, who’s using data operations? This is the big difference between DataOps and DevOps—the users. DevOps typically has engineering—software engineers that know multiple languages all dedicated to streamlining the orchestration of that technical delivery. In DataOps, we have other roles. We now add data scientists and typically data analysts that don’t care about all the technical-orchestration details. They want to make sure that their models can be simulated, executed, and that the data or the outcomes—and, ultimately, the insights—are usable and can be transformed into some benefit for their business users.

As you think about DataOps versus DevOps, reflect for a minute. There might be an opportunity in your environment to emphasize DataOps to orchestrate and streamline the workflow of how your team generates quality analytics for your business partners.

Hi, I’m Peter Nichol, Data Science CIO. Have a great day!

Citizen development offers solutions for data analytics resource constraints

What if I said you could add 15 developers to your team, and it wouldn’t cost you anything?

Hi, I’m Peter Nichol, Data Science CIO.

Today we’re going to talk about citizen development. Most of our days are spent trying to put out fires and rationalizing rogue applications developed outside of standard IT governance and protocols.

As fun as that can be, what if there was a way that we could enable our users to drive data-science initiatives? Historically, we talked about power users or evangelists when resources were low and business partners demanded that they develop business-intelligence reports. Our goal at the time was to enable our business partners to be more effective and self-sufficient.

The idea behind citizen development is to provide your business partners with capabilities to function independently and in parallel with IT. The theory is to introduce business users to low-code or no-code environments. Through this process, we can accelerate development and lower the barrier to entry to develop data insights. As it turns out, 25% of citizen developers have no coding background at all. Typically, almost 70% are able to build applications that are functional in less than three months. Not bad for nearly zero coding experience.

What does this mean to you? You already have resources at your disposal in your company that are idle. These resources are dormant; they need to be discovered and activated. Using this approach, if we can inspire and activate those individuals, we increase our resource capacity. We now have additional resources to which we previously didn’t have access to leverage, and the cost is nearly zero dollars to do this—the kicker.

The theory is that by focusing on different types of IDEs or development environments, we can enable these resources to do their development and build their applications. IDE environments like BlueJ, Eclipse, AWS Cloud 9, Code Blocks, and several other tools exist to provide business partners with capabilities and functionalities to develop their applications seamlessly.

It sounds like business users can now create anything they want. They can—with only one minor exception. Once those applications are developed, they must be run through a conventional IT governance process for compliance, security, and enterprise-standards adherence. Instead of business partners bringing in their own IT teams to do things better, faster, and cheaper, they converge with internal IT teams. Business partners no longer work on rogue IT initiatives that were developed in isolation. We’re collaborating as one team. We’re starting to converge.

The added benefit for business partners is getting trained on IT’s obstacles while working hard to deliver our organization’s functionality. Convergence is the whole point of citizen development. It allows our business leaders to experiment and accelerate as fast as possible on their own with guard rails. This provides different value opportunities and inspires leaders to develop and build functionality to support our business operations.

Does your department have a backlog of issues that have been requested over the last, say, six or nine months? Your team has a limited number of developers, data analysts, data scientists, and capable programmers. Your capacity isn’t infinite, yet the demand for new requests seems almost endless. By leveraging citizen development, we now have tools and techniques to help burn down that backlog and converge as one unified team.

Hi, I’m Peter Nichol, Data Science CIO. Have a great day!