
Assessing exchange suitability must be weighed against the primary alternative: defaulting to the Federally-Facilitated Marketplace (FFM).
States will be charged a user fee rate of 3.5 percent of the premium for 2017 when leveraging FFM services. Understanding exchange enrollments, cost per member to operate, cost saving (or loss) by not operating on the FFM, and per member per month costs is essential to making informed operational decisions.
This directly speaks to leadership effectiveness. Every state-based exchange has a story.
Exchange enrollments
The Kaiser Family Foundation published 2016 enrollment for the remaining twelve state-based health insurance exchanges including (rounded to thousands for brevity): California (1,575,000), Colorado (151,000), Connecticut (116,000), District of Columbia (23,000), Idaho (101,000), Kentucky (94,000), Maryland (162,000), Massachusetts (214,000), Minnesota (86,000), New York (218,000), Rhode Island (35,000), Vermont (30,000), and Washington (201,000).
This is helpful. However, we’re missing the average monthly premium. According to a Department of Health and Human Services report issued on January 21, 2016, the average monthly premium before APTC is $408 and the average monthly premium after APTC is $113. We’ll focus on the average monthly premium before APTC for the below observations.
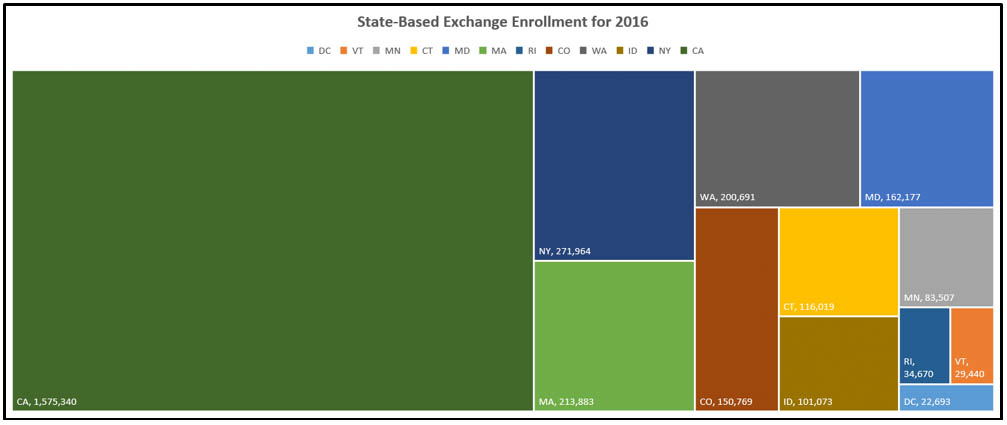
This chart illustrates the state-based exchange enrollment for 2016, to highlight enrollment volume by each state.
After analyzing this chart, the average enrollment of all twelve state-based exchanges is 246,852, and the average PMPM is $44. Does a minimum enrollment help drive down costs? It appears that it does. Economies of scale apply here.
Exchange cost to operate
Below is the cost for each exchange after initial transition costs to run on the FFM: California (270.0MM), Colorado (25.8MM), Connecticut (19.9MM), District of Columbia (3.9MM), Idaho (17.3MM), Maryland (27.8MM), Massachusetts (36.7MM), Minnesota (14.3MM), New York (46.6MM), Rhode Island (5.9MM), Vermont (5.0MM), and Washington (34.4MM). What do these numbers mean? These numbers provide a financial benchmark, under which the state-based exchanges would save taxpayers money. If state-based exchange budgets are over the FFM benchmark, taxpayers are paying for the extra costs. We can take the delta from the FFM estimated the cost and the approved exchange budgets to determine cost savings or additional capital required to run the state-based exchange. The results are grim.
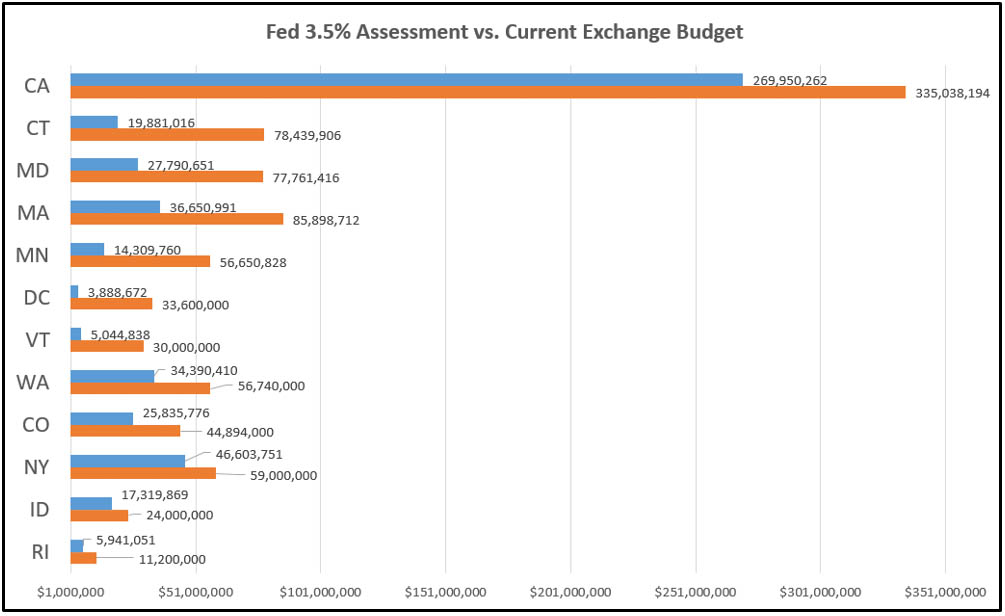
This chart illustrates the difference between the state running as a state-based marketplace compared to the cost to run on the FFM with an assessment of 3.5 percent based on current enrollment. The current state budget is orange, and the proposed Fed cost is in blue.
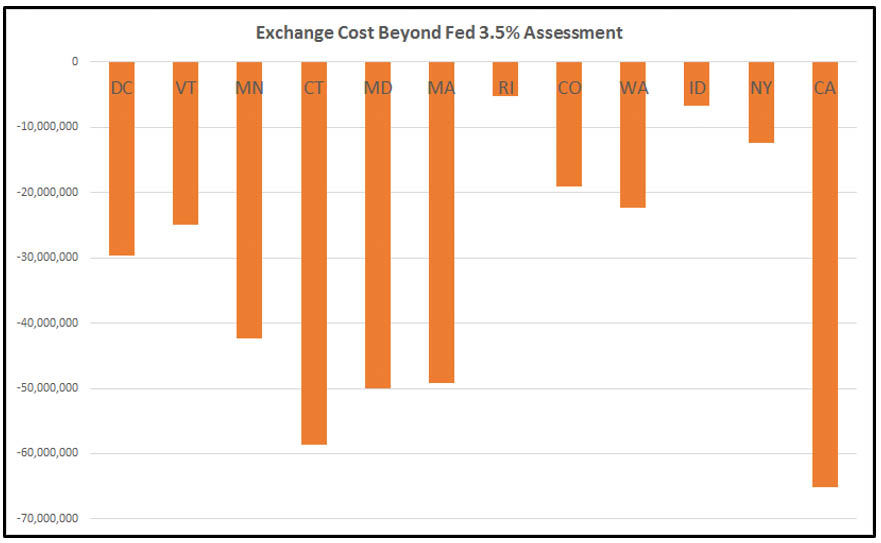
This chart illustrates the savings or cost to taxpayers if the exchange was to operate under the FFM model as opposed to the existing state-based exchange models.
Cost to tax-payers
There are no exchanges that operate below the FFM 3.5 percent assessment. The below chart illustrates exchanges leaders and lagers. If the state-based exchange were operating at the same cost as the FFM, this percentage would be 100 percent, therefore below 100 percent is beating FFM cost to operate the exchange and over 100 percent is more than the FFM cost to operate. The state percentages are as follows: California (114 percent), Colorado (174 percent), Connecticut (395 percent), District of Columbia (864 percent), Idaho (139 percent), Maryland (280 percent), Massachusetts (234 percent), Minnesota (396 percent), New York (124 percent), Rhode Island (189 percent), Vermont (595 percent), and Washington (165 percent).
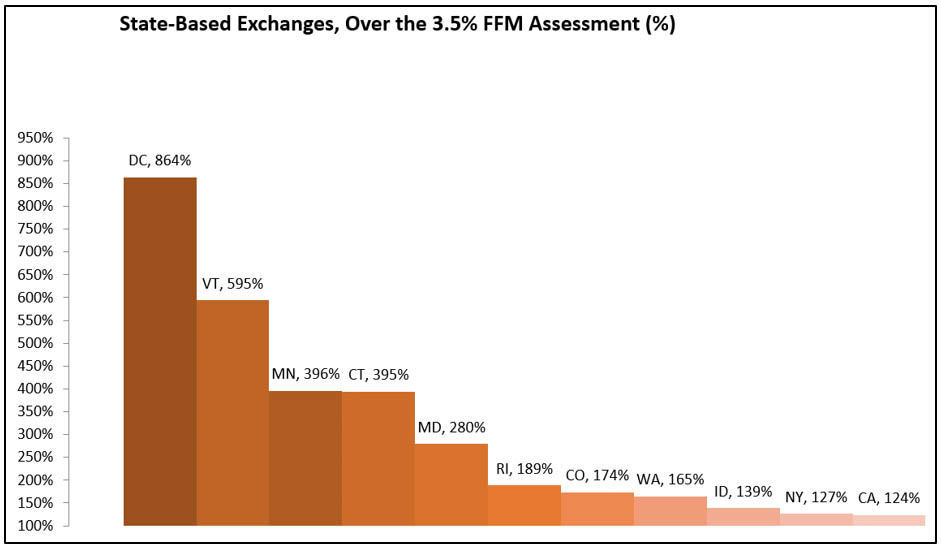
This chart illustrates the cost of the FFM fee that it costs states by running their exchange.
Exchange per member per month (PMPM) state averages
Assessing exchanges can be complex. Exchanges segment out Medicaid costs that are recouped through reimbursement channels. Open grants decrease needed operational capital making exchange budgets look suppressed for some years; they balloon when grants expire, as in the case of the New York exchange where costs are $59 million in 2017 then jump to $87 million in 2018.
Regardless per member per month, can help us level costs and better understand the efficiency of exchanges. PMPM are forecasted at 2016 budgets with the exceptions of New York (2017) and California (2017). PMPM, calculated based on latest budget information, for the state-based exchanges are as follows: California ($18), Colorado ($25), Connecticut ($56), District of Columbia ($123), Idaho ($20), Maryland ($40), Massachusetts ($33), Minnesota ($57), New York ($18), Rhode Island ($27), Vermont ($85), and Washington ($24).
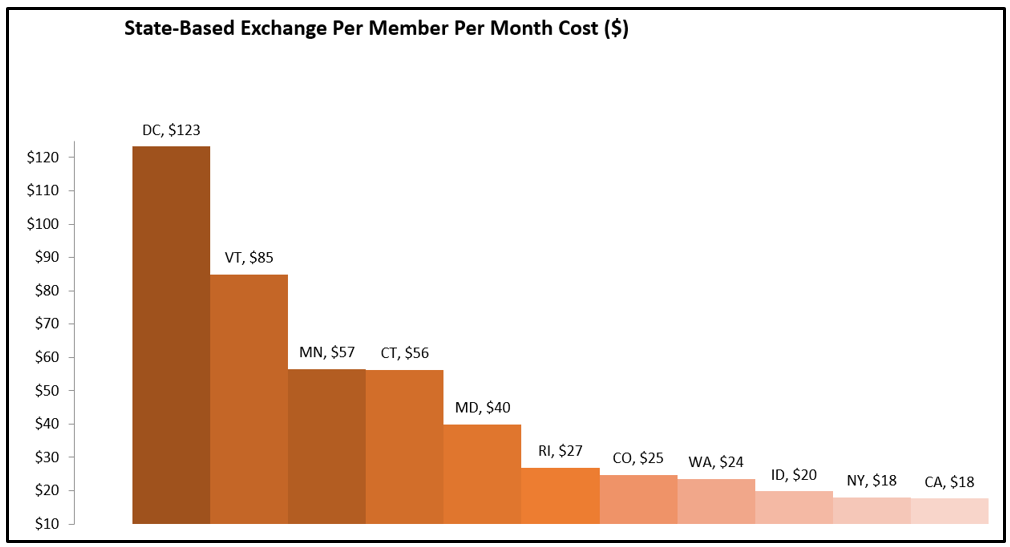
This chart illustrates the PMPM cost by each exchange, representing operational efficiency per member.
As of July 2016, there is not a single state-based exchange that is operating more efficiently than the proposed 3.5% assessment from the Feds. A state with an assessment of 1.99 percent or 1.65% does not mean it beats the assessment of the Fed at 3.5 percent, regarding total cost of ownership. All relevant operational cost must be taken into account (cost sharing with Medicaid, grants, additional funding with the exception of organic revenue). Generating enough funding to be operational, is not the same as states operating more efficiently than the alternative of defaulting to the FFM.
Sustainability myths
Let’s explore Connecticut as a specific example. In my opinion, it was incorrectly published by the Hartford Business Journal in the article, Contracts Drive up Access Health’s FY17 budget, that Access Health CT’s (the Connecticut Health Insurance Exchange), board “approved a $34.6 million budget for the fiscal year that begins July 1.” The actual budget to operate Access Health CT for 2017 is $66.3 MM ($27.7MM reimbursed by the Connecticut Department of Social Services (CTDSS), $2.1MM in grants, and $34.6MM from Access Health CT). Please notice that due to rounding the budget may not tie out exactly. With current membership, if AHCT utilized the Federal-Facilitated Marketplace in 2016 it would have cost Connecticut taxpayers only $19.9MM, not $66.3MM – a savings of $58.6MM in 2016.
This begs the question, can Access Health CT operate on $34.6MM? The answer is no. Also, $34.6MM is not the Access Health CT budget for operations. AHCT is not sustainable without heavy ($29.7MM in 2017) subsidization from the Connecticut Department of Social Services.
Access Health CT is charging the CTDSS to use services such as the call center. These services are costing CT taxpayers more than if operated under the FFM (healthcare.gov). As you can observe from the financial analysis, Access Health CT is subsidized by CTDSS in the amount of 27.7MM a year in 2016. Connecticut’s desire for self-sufficiency is admirable but Connecticut is operating an exchange at a cost more than the FFM would charge. This misstep is costing Connecticut taxpayers an additional $56.8MM in 2016. Is the Connecticut exchange sustainable? No, leadership needs to make changes to honor the initial legislation that empowered Access Health CT to run a state-based exchange.
Five questions boards should ask
The Kentucky and Hawaii exchanges have already defaulted to the FMM, while several state-based marketplaces and federally-supported state-based marketplaces are hopeful that a consortium will offer sustainability solutions.
The state-based exchange leadership has unfortunately not been effective achieving sustainability targets. Health, insurance exchange boards, need to ask themselves five questions:
- Do we have the right incentives? e.g. why aren’t the exchange employees covered under the same health plans they administer?
- Are we running better than the Fed 3.5% assessment, when looking at total cost of ownership? e.g. sustainability is beating the Fed at 3.5 percent of the premium. Is our Exchange doing this?
- What is the balance between management and non-management positions when exchanges are in maintenance mode? e.g. adjust salaries to standard state job classifications.
- Where are the monthly customer surveys? e.g. many states conduct internal staff satisfaction surveys on leadership and external surveys around the customer experience, yet they are not publically available. Why?
- Is a c-suite really needed for programs under $100 MM? e.g. isn’t there a better organizational design alternative to the classic command and control structure? Why have two organizations when the states performed the same functions?
These questions and more keep exchange leaders and the impacted taxpayers up at night.
References
Charity Dynamics. (2014). 4 Recommendations for Smart Interactive Investments (online image). Retrieved July 6, 2016, from http://blog.charitydynamics.com/4-recommendations-smart-ii/