Can you answer the following questions?
- Do you know your quarterly results?
- Do you know how your team is performing?
- Which aspects of your plan are working out great and which aren’t exactly running according to your goals? Is your team getting it done?
- How is financial performance trending for your organization or department?
- Are business issues being resolved, or is that debt growing?
- What does your year-end look like based on your performance?
I’m going to share some insights to help you answer these questions.
Hi, I’m Peter Nichol, Data Science CIO.
Today we’re going to talk about predictive analytics, but this might not be what you think it is. We’re not going to cover digital asset twins, where we try to understand digital sources’ physical properties. Operational digital twins are out of scope in this article, too. Operational digital twins have to do with digitizing the supply chain. Future digital twins are also not part of our discussion. We’re usually looking at real-time streaming information and using computational models to help understand neural networks.
What we are going to talk about is a simple, predictive-analytics example applied to day-to-day business operations. Let’s shift away from model discovery, asset management, and risk management into a practical design that works. We’ll explore a model I’ve been using for years that’s highly impactful. Here’s how it works.
Every day and every quarter, we try to predict future outcomes. We try to use predictive analytics to offer insights into future events based on previous events. We know our results from yesterday. We know our results today. In theory, can’t we predict our performance for tomorrow, next week, or next month? Yes, we can. That’s precisely what we’re going to do in this discussion.
Here’s the good news. You don’t need Minitab. You’re not going to need the IBM SPSS Statistics package or Rstudio, JMP, or even OriginPro. Excel will work just fine (although all those tools are compelling when applied to a suitable problem space).
This simple application is in the form of a side-by-side bar chart with a cumulative trend line. The first will model financial variance, and the second will be leveraged to predict trending rates and identify abnormalities.
Financial variance model
Our problem statement is that we’re attempting to model our future financial variance based on historical information. While this is far from a perfect model, the principle is that historical performance will be an indicator of future performance. Essentially, we want to answer this question: If we stay on the current path, what will be our financial variance at year-end?
We start with a model of our planned spend monthly and roll that up to our annual forecast or budget. Hopefully, this isn’t a flatline model—i.e., $1 million a month that’s flatlined—as this model assumes that every month is equivalent, which is rarely the case. We need to consider environmental variances, the cyclical nature of payment schedules, and other inherent business operations challenges. We need to look at each month separately. Once you have that number, it will be your forecasted spend.
Every month, the books will eventually close, and we’ll have actuals for that prior month—the actual spend. We now can chart these two values per month in a side-by-side bar chart to visually depict the variation.
On top of these bars, we’ll overlay a trend line representing the cumulative variance over time. For example, let’s say our January forecasted spend was $1MM and our actual spend was $800k; we have a variance of $200k that will go into the trend line. In February, if our forecast is $1.2MM and our actual spend is $1.0MM, we have another $200k variance. In this model, the February trend line would be $400k ($200k + 200k), and so on. This visualization immediately shows whether we’re heading toward our objective of low variance or if our variance is growing. This allows us, as an executive, to immediately take corrective action before the year-end numbers are locked down. Similarly, we can use this same model to chart variations and adherence and see how close we’ll be at the target end for multiple variables including defects, disputes, sprints, features, enhancements, product launches, etc.
Defect variance model
We can use our same model to chart variations and adherence for defects. The model is applied in this way: Our problem statement, in this case, is: How many defects will we have at year-end? We use a forecasted model to determine how many defects we think will be created per month. One bar chart will be defects created. We’ll also track how many actual defects were resolved each month. We’ll label these defects resolved. Similar to the model above, we’ll chart these two values monthly, side-by-side. Then we’ll use the cumulative delta—i.e., defects not closed or additional defects burned down over our target—as our trend line. This trend line now becomes our backlog.
Whether we’re accumulating 2,300 issues a month, 50 issues a month, or whatever it is, we can quickly identify a trend. It’s straightforward to see the trend because the trend line is either increasing or decreasing. The result is we’re able to perform and predict the difference in future outcomes. Are we heading in the right direction, or are we not?
By applying these simple techniques, you’ll have a powerful tool to anticipate the business and operational changes required to ensure that your department posts outstanding year-end results.
Hi, I’m Peter Nichol, Data Science CIO. Have a great week! Cheers.
Chart 1.0 Prediction Trend
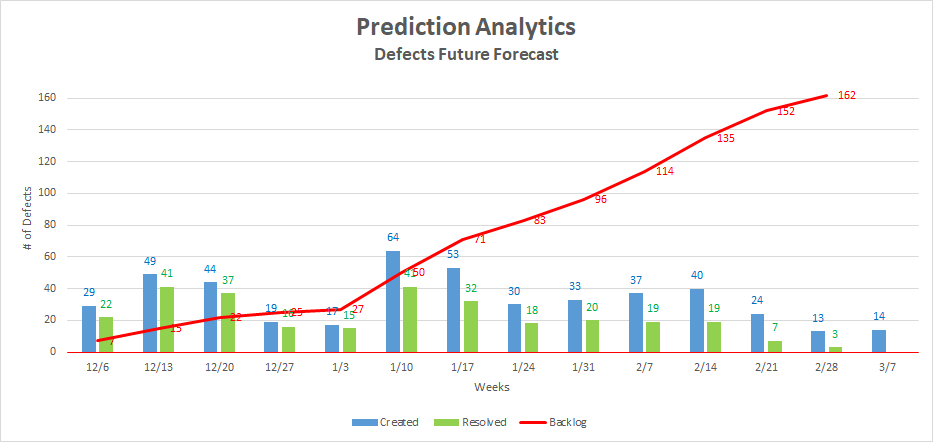
Chart 2.0 Team Velocity
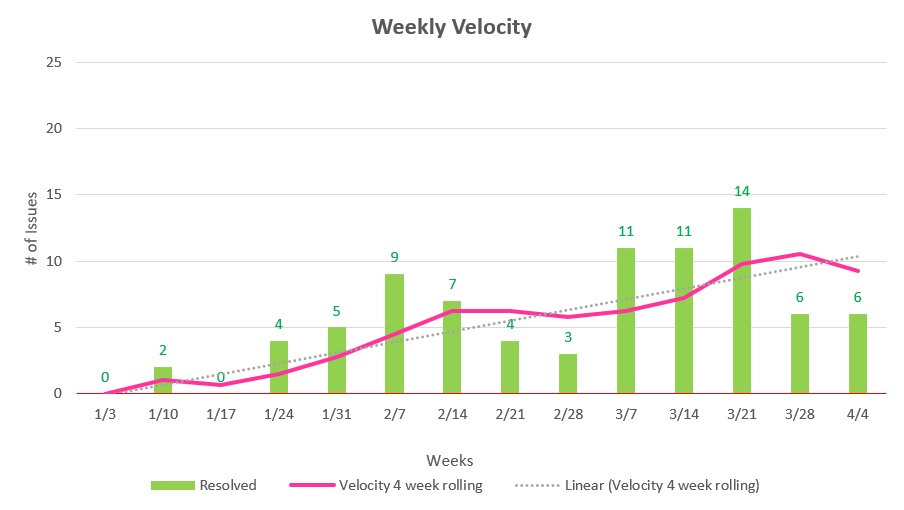
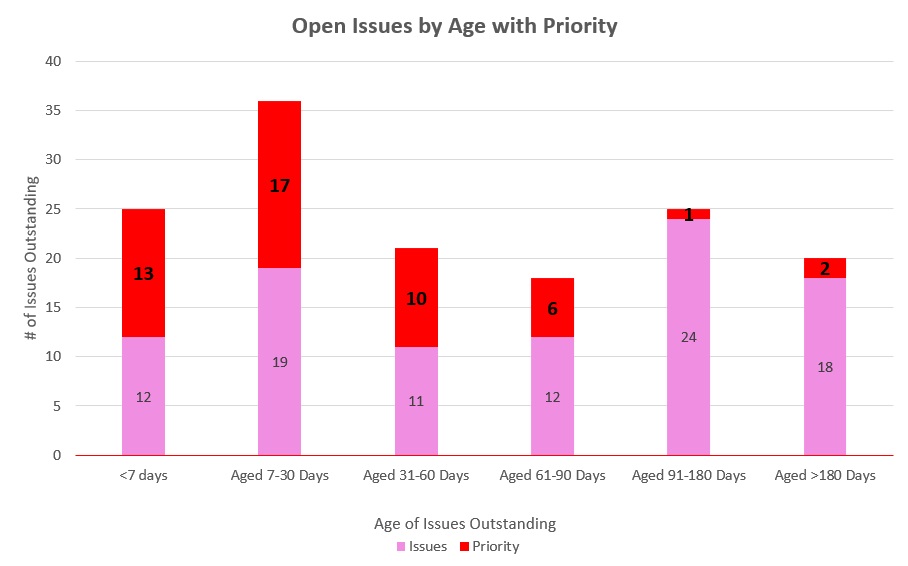
Chart 3.0 Open Issues by Age
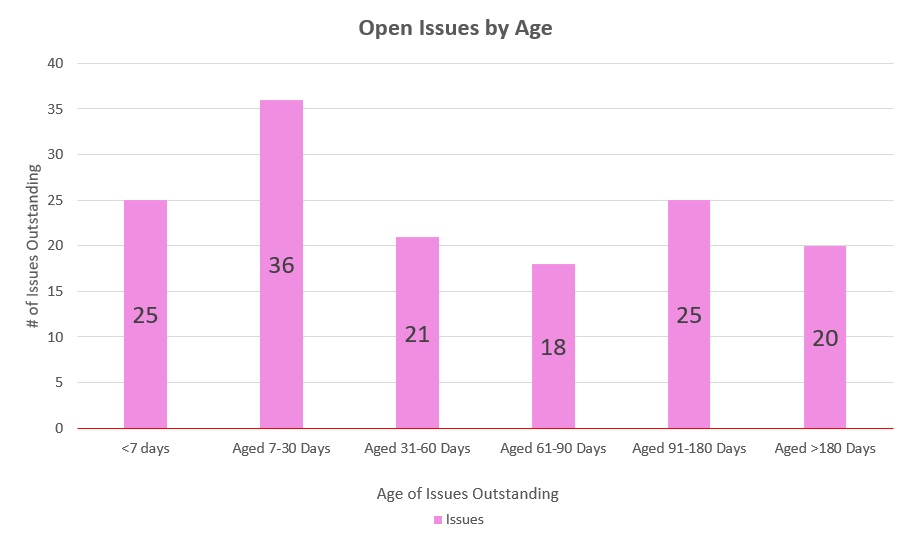
Chart 4.0 Open Issues by Age with Priority